OVERVIEW
The U.S. stock market, as measured by the S&P 500 Index, ended the week lower by around 1.3 percent after another teeter-totter week of trading.
Implied volatility continued to drop, however, as the CBOE S&P 500 Volatility Index fell to under 36, the lowest reading in over a month.
Internationally, both developed and emerging market stocks underperformed the United States’ stock market, falling more than two percent.
The yield on the U.S. 10-Year Treasury Note ticked lower to roughly 0.61 percent, resulting in moderate gains for long-term Treasuries.
Oil caused a stir last Monday as prices dropped deep into negative territory. The collapse in energy demand due to the pandemic has led to a massive oversupply of oil with no place to store it.
The price of gold, on the other hand, climbed over two percent last week and is up nearly 14 percent for the year.
KEY CONSIDERATIONS
Shifting Momentum – The stock market is not a physical system beholden to the laws of physics like a thrown ball or a rocket ship blasting off into space. However, it is comprised of human beings whose collective actions produce momentum-like effects from time to time. For this reason, we pay attention to the signs that warn us of rising or falling momentum in stock prices.
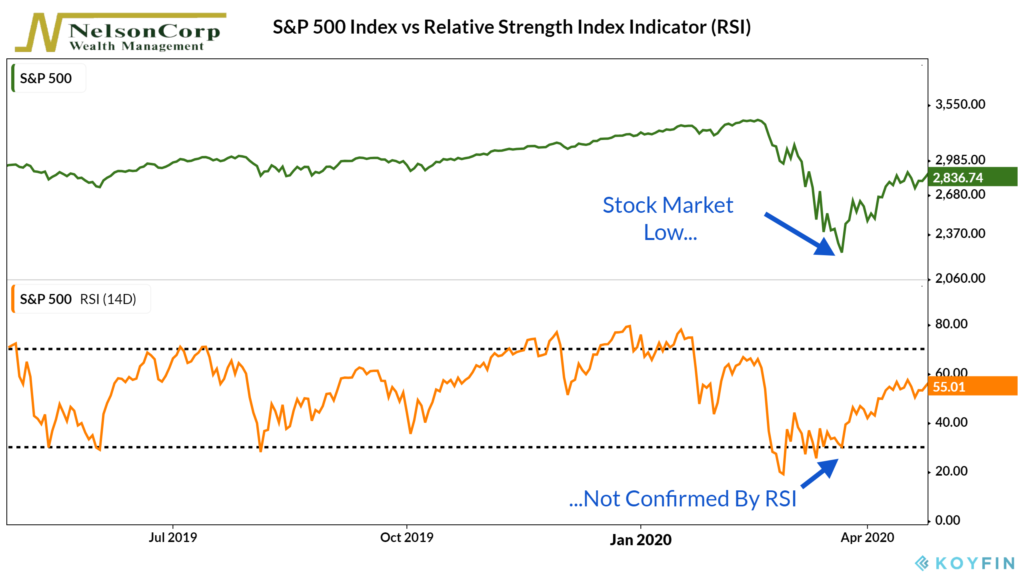
The trusty ole Relative Strength Index (RSI) is one such indicator that we have mentioned in the past, as it does a decent job of illustrating momentum and condensing what some of our more in-depth indicators are saying.
Earlier this year, the RSI indicator warned that stock momentum had sizzled out when it failed to confirm the S&P 500’s new highs. And now, it has warned that the recent lows from March were not confirmed either. The RSI diverged to the upside, and the stock market has rallied since then.
We also monitor where momentum has reversed by comparing the 1-year (252-day) return of the S&P 500 index to its 3-month variation in returns, or standard deviation. It sounds complicated, but it recently signaled that stocks had fallen sharply outside of their normal range but have now reversed back inside of that zone.
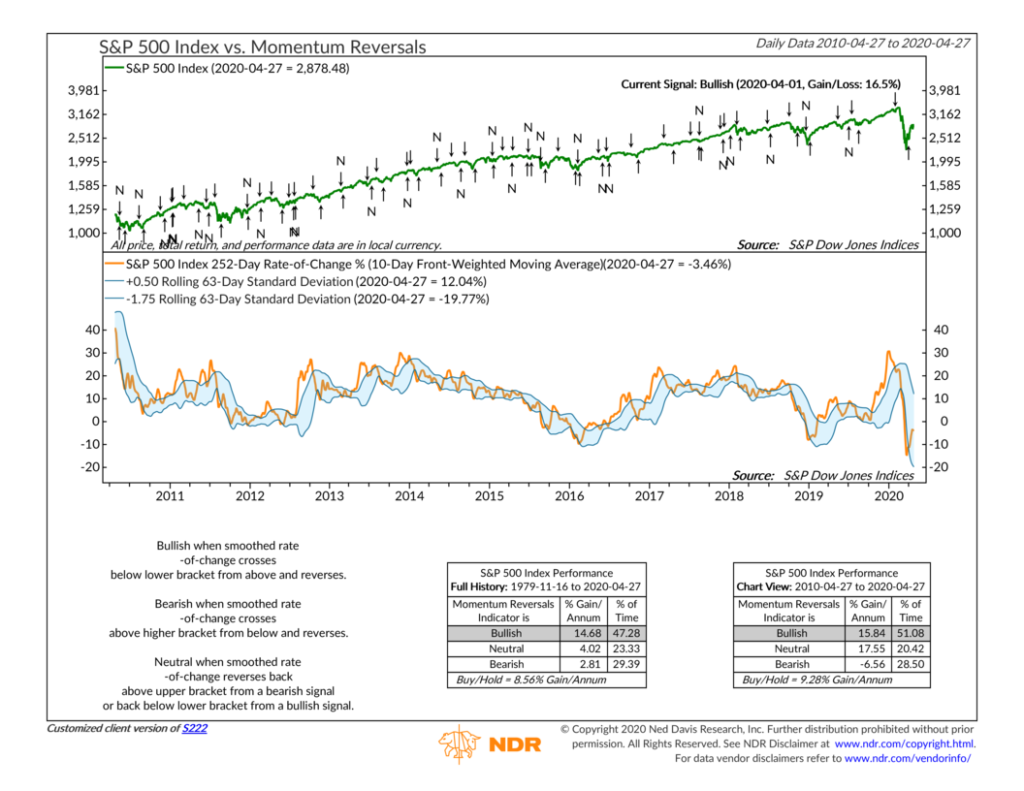
The takeaway? Stocks are like a juggernaut; once they reverse course and pick up momentum, they can continue higher for some time.
Overall, however, the weight of the evidence from the momentum indicators that we track suggests that stocks are at most a neutral risk at this time. Which, given the fact that the ever-worsening economic data could fill multiple pages at this point, that feels about right.
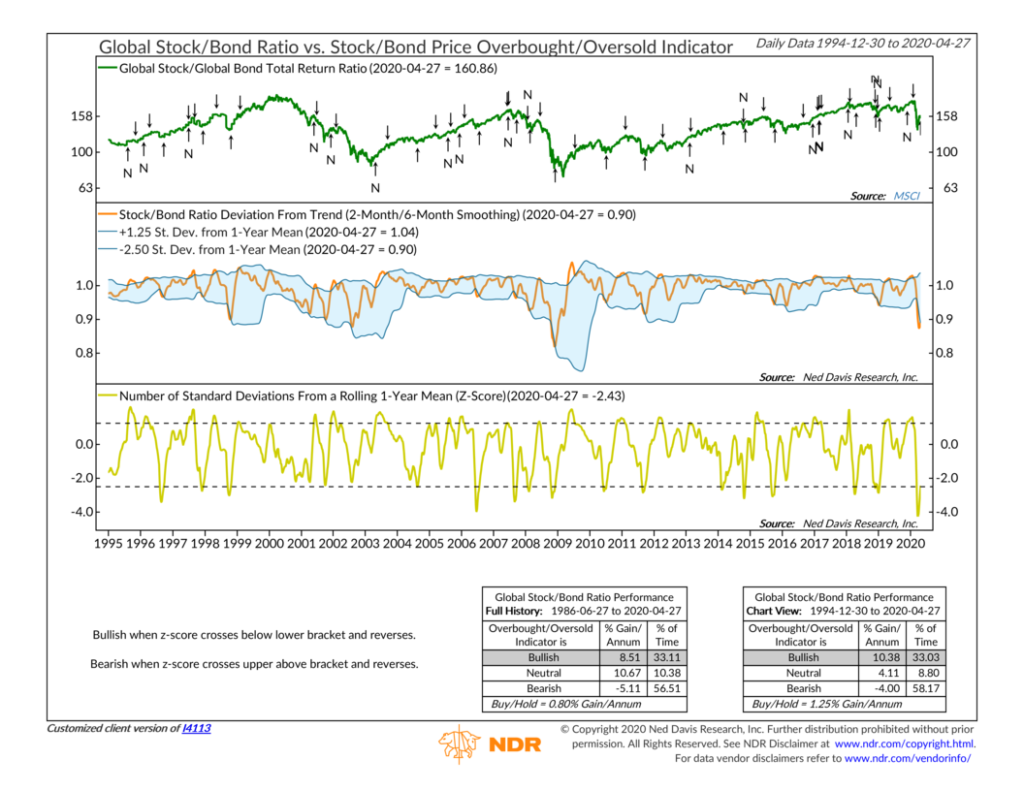
Oversold Stock & Bulls vs. Bears – Improvements in areas other than momentum are also needed to move the weight of the evidence in a more bullish direction. One component of the investor behavior category of risk that we monitor is already there: overbought/oversold conditions.
Most of the indicators in this category suggest that stocks have reached oversold conditions. In the coming days, we will likely see another of these indicators flip positive. This particular indicator is based on the concept of mean reversion applied to the ratio of stocks to bonds. I won’t bore you with the calculation, but this indicator is showing that bonds have outperformed stocks by a large margin this year, but that this has recently reversed course and is close to turning back in favor of stocks.
However, the one area that we would like to see turn bullish is sentiment based on surveys and polls. It’s when pessimism is at extremes that stocks become good buys.
In particular, the American Association of Individual Investors survey is at its lowest level of the year and is quite pessimistic, with just 40 percent of responses as bullish. But, based on historical readings, it has room to fall further.
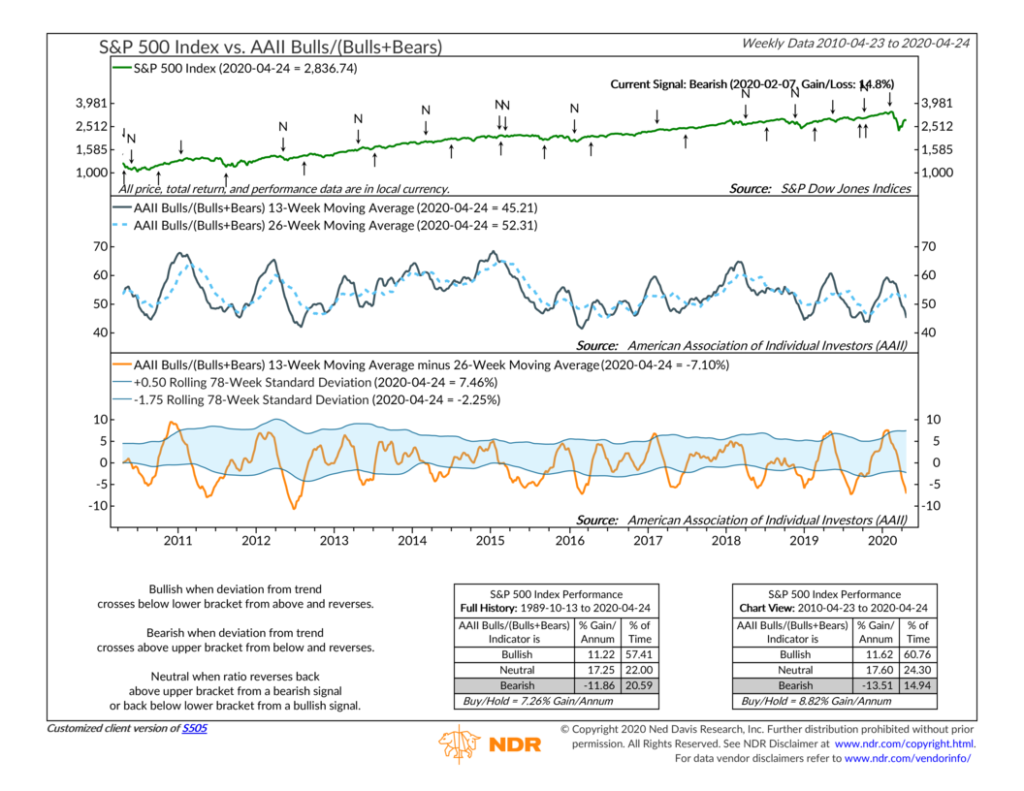
Of course, it may not reach those lower levels, in which case we would need to see its shorter-term moving average improve relative to its longer-term moving average in a way that gives a bullish reversal from a pessimistic low. When that happens, it means investors have capitulated and extreme pessimism has subsided.
This is intended for informational purposes only and should not be used as the primary basis for an investment decision. Consult an advisor for your personal situation.
Indices mentioned are unmanaged, do not incur fees, and cannot be invested into directly.
Past performance does not guarantee future results.