OVERVIEW
The U.S. stock market finished a strong month of July, with the S&P 500 soaring 4.26% for the week. The Dow Jones Industrial Average posted a gain of 2.97%, and the Nasdaq Composite rose 4.7%.
Foreign stocks did well, too. Developed country stocks posted gains of 2.1%, and emerging markets rose a moderate 0.34% for the week.
The bond market rallied. Treasuries posted strong price gains as the yield on the 10-year Treasury note fell to 2.65%, down from 2.76% the week before. Investment-grade bonds gained 0.5%, and high-yield (junk) bonds rose about 1.5%.
Not to be left behind, real assets had a great week also. Real estate surged 4.71%, and commodities rose 4.55%. Specifically, oil gained 4.7%, gold rose 2.09%, and corn skyrocketed 9.22%. All this was helped by a rare decline in the U.S. dollar, which fell about 0.67% for the week.
KEY CONSIDERATIONS
Signs of Life, But Market Must Prove Itself – The stock market had quite a month. The S&P 500 rose more than 9% in July, its best month since November 2020.
In fact, the rally off the mid-June low was so strong that it triggered a positive signal from our stock market reversal indicator.
The rules for a positive signal are fairly simple: when the S&P 500 rises 8.4% or more from a recent low on a weekly closing basis, a “buy” signal is generated.
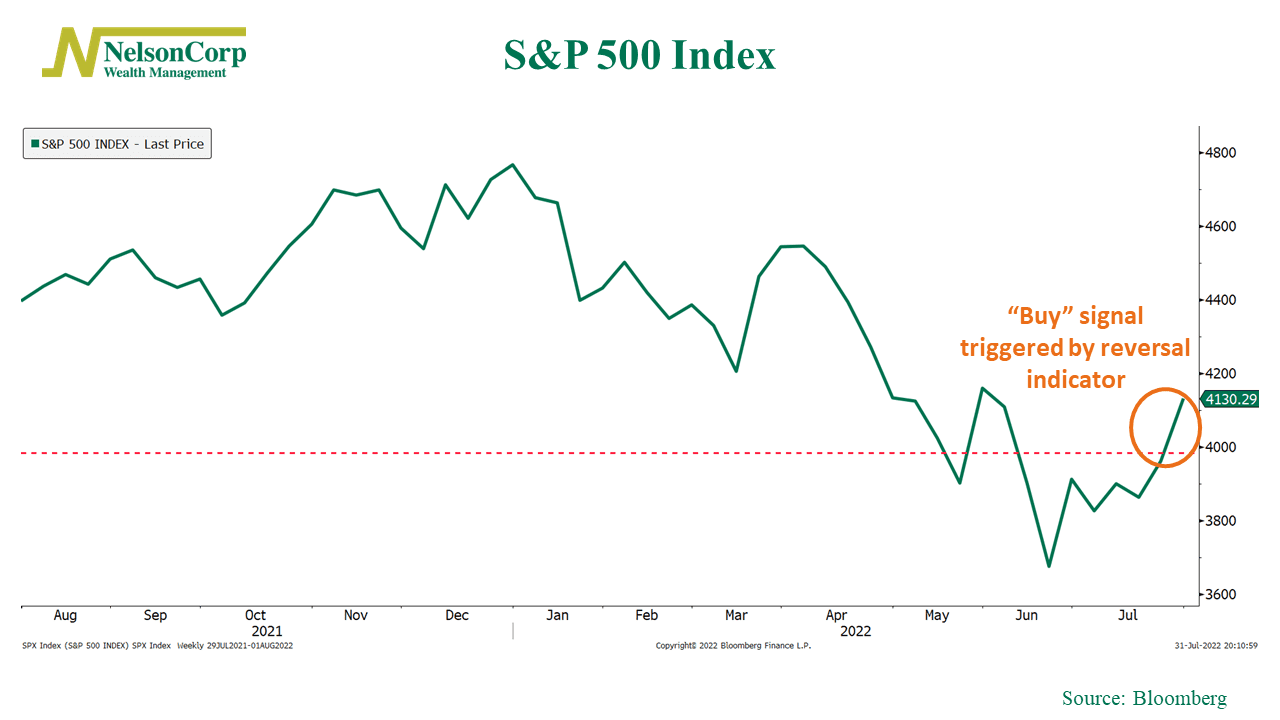
The key rally point is highlighted on the chart above. As you can see, the S&P 500 blew past that level last week.
Now, this is only one indicator. Most of the other trend-based indicators that we track still suggest the bias in the market’s trend is to the downside. But still, this is a step in the right direction. And if the market has formed a bottom, this would be one of the early warning signs.
But why is the market rallying now, especially given all the signs of an economic slowdown?
Well, for one, the market is a forward-looking machine.
As we pointed out in this week’s Chart of the week, the market tends to bottom and rally well before an official recession is even declared. More so, a year after a bottom is formed, the S&P 500 has risen an average of 40%!
Interest rates have played a role, too. Since mid-June, the yield on the 10-year Treasury note—the most widely followed bond gauge—has plunged from about 3.5% to roughly 2.7%. Stocks have rallied because falling interest rates push stock prices higher almost automatically by raising market valuations.
The chart below shows how the 10-year Treasury rate (green line) has fallen drastically over the past month, while short-term rates (the gold line) have surged. The orange line at the bottom shows the difference between these long and short-term rates. As you can see, it recently fell below zero, resulting in an inverted yield curve.
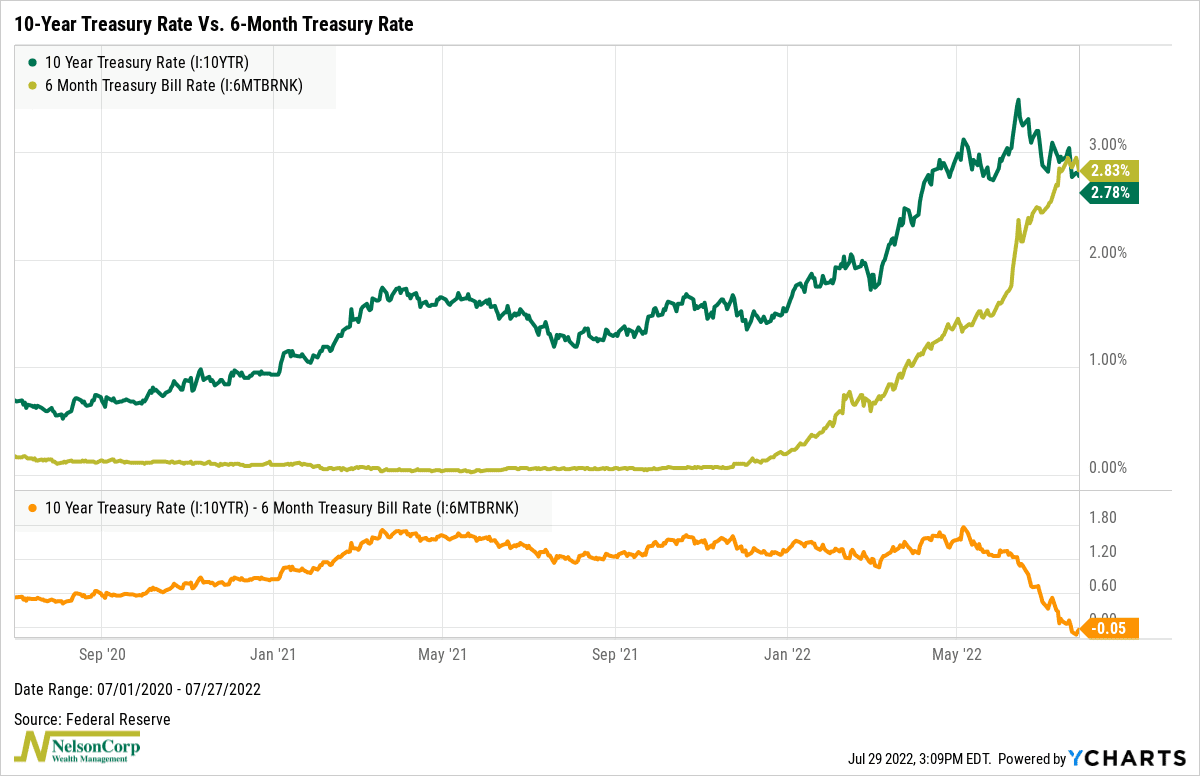
In other words, long-term rates have fallen because expectations about growth and inflation have fallen. So, in a way, the fears of the slowdown are helping drive stock prices higher.
With all that said, however, the market still needs to prove itself here, especially given how bad the price trend has been and how unfavorable the underlying economic environment is.
As always, the weight of the evidence is key.
For example, a breadth thrust from the indicator below would be nice.
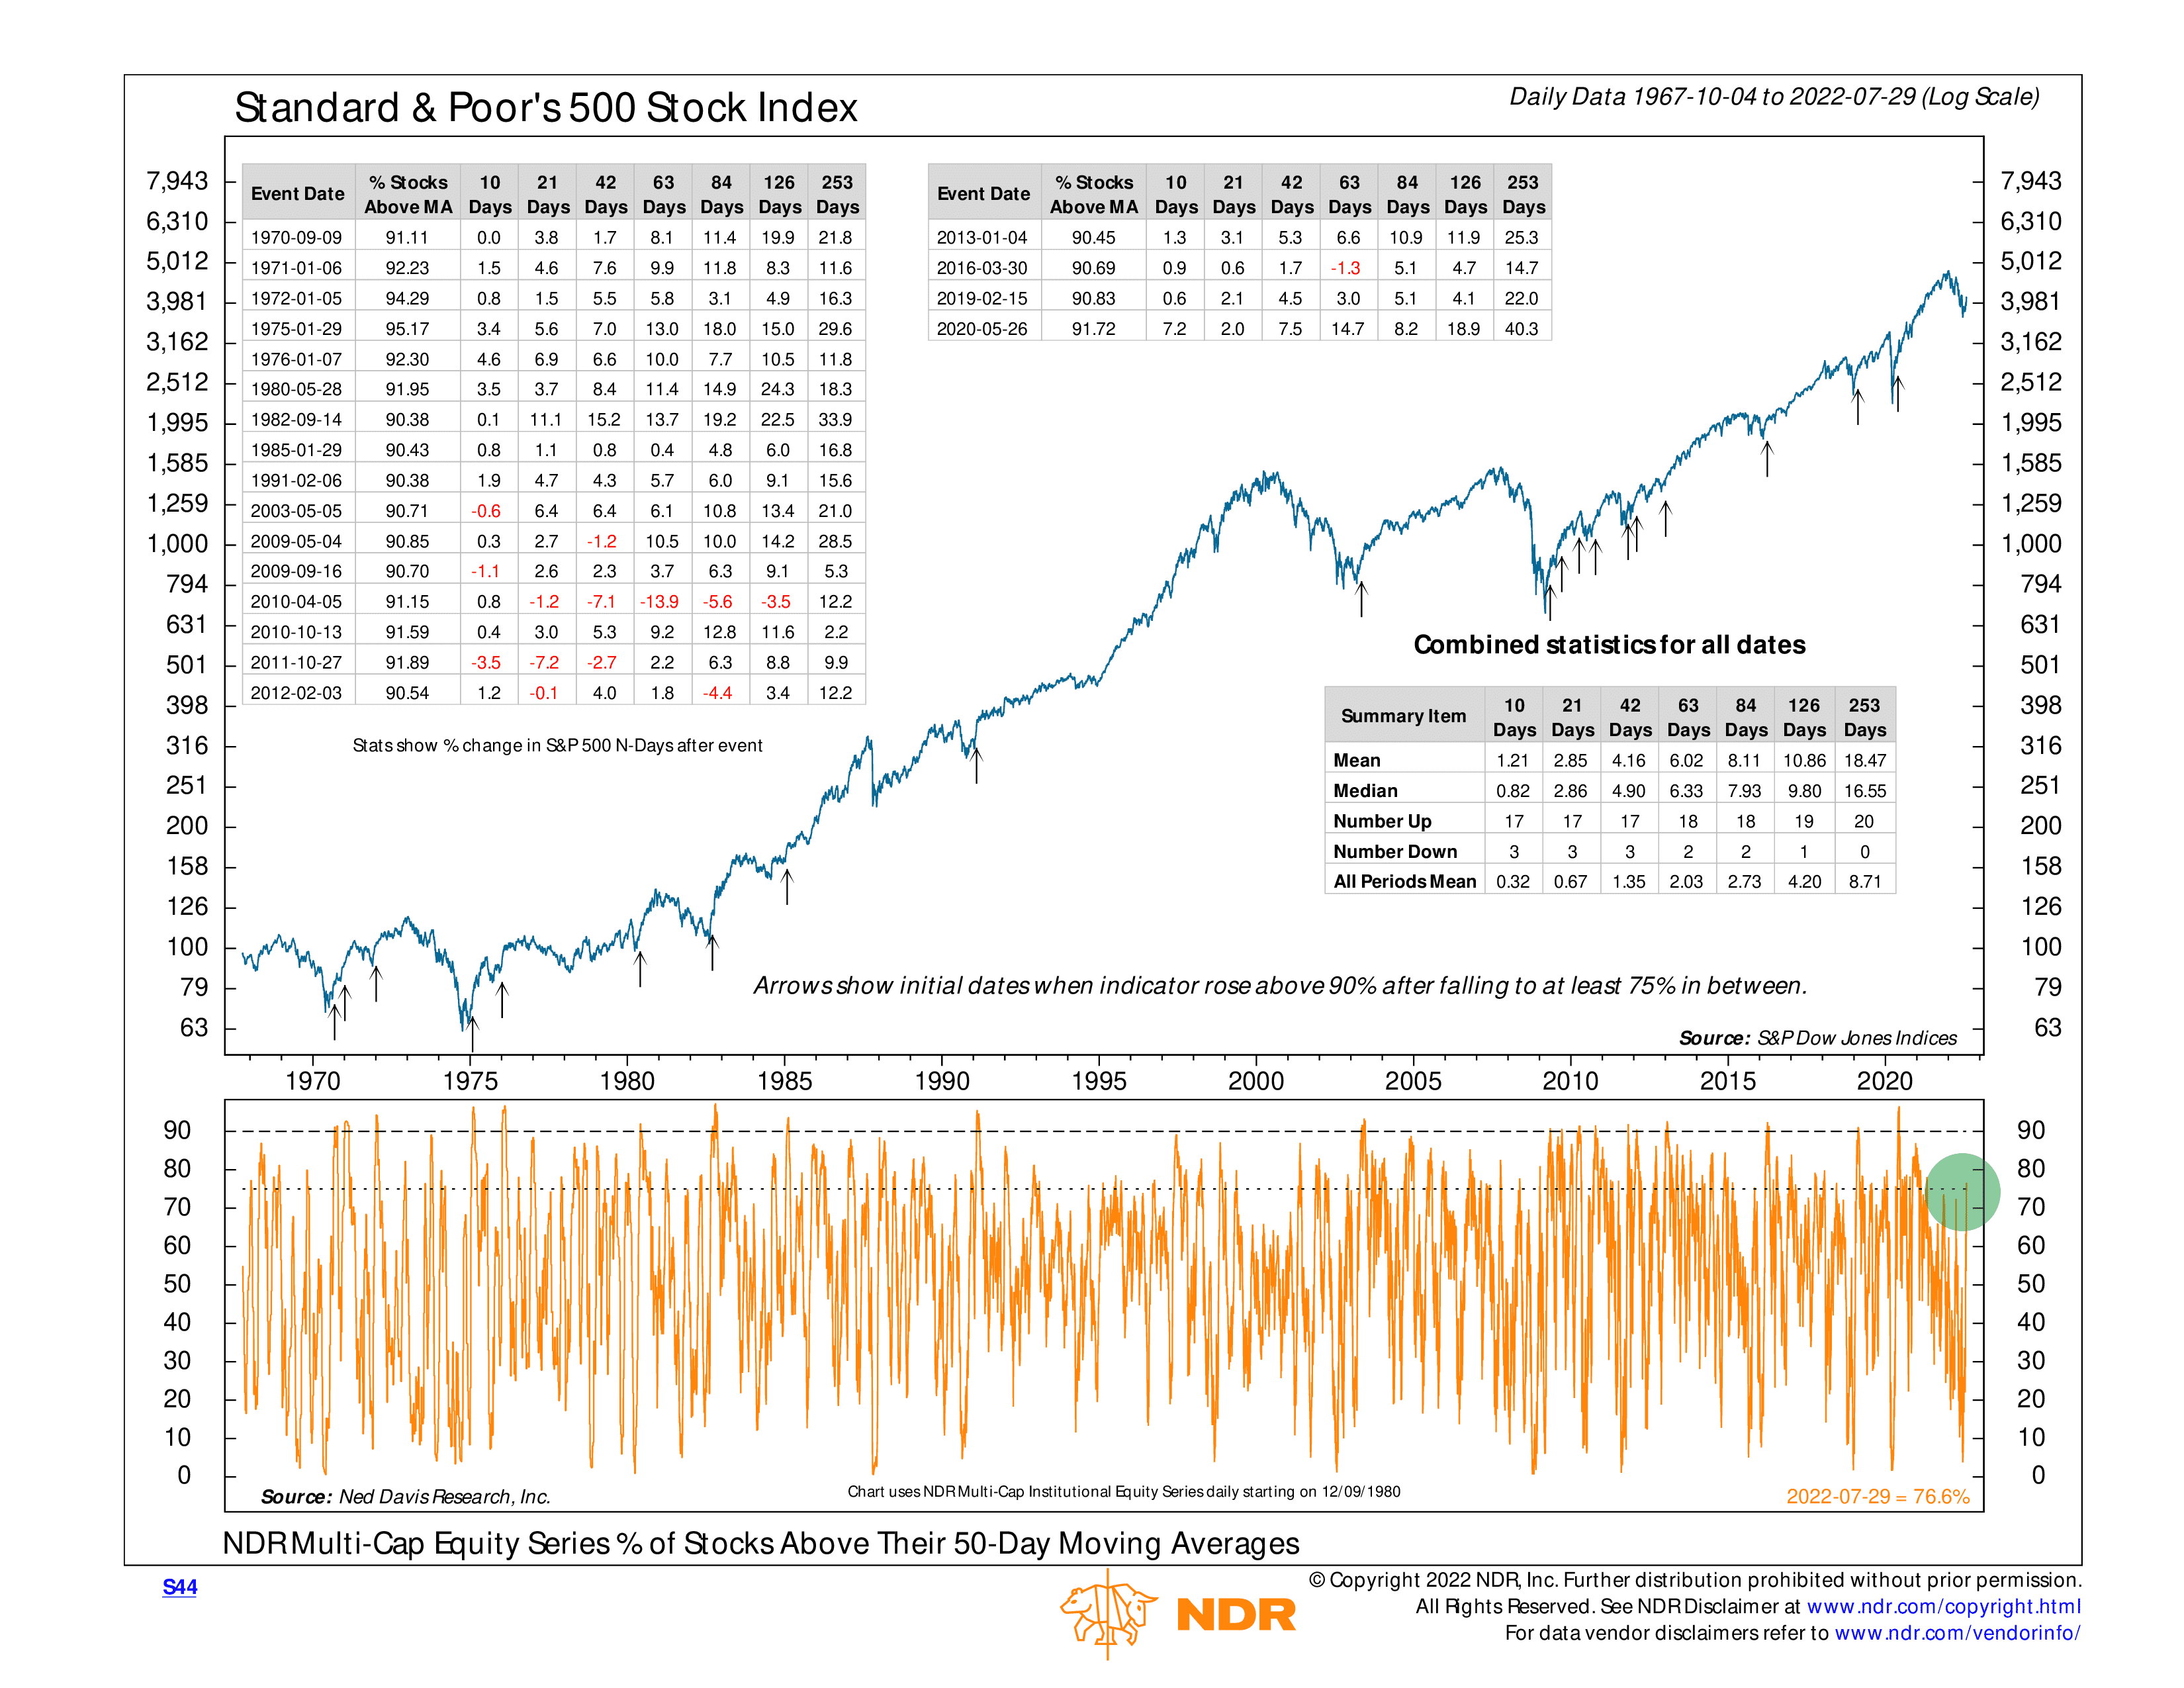
This indicator shows the percentage of stocks in the market that are trading above their 50-day average price. Historically, when this metric has risen above 90%, it’s been a positive sign for the overall market. In fact, we’ve seen these sorts of breadth thrusts occur during rallies off the bottom of nearly every major downturn in the stock market going back to the 1970s.
Last week, it rose to roughly 76%, which was a pretty good jump. Fifty trading days is a little more than two months, so we could see this improve quite a bit in the weeks ahead as the poor June prices fall off and are replaced with the stronger July prices.
The good news is that we saw some shorter-term breadth thrust indicators flip positive last week. One is based on the 10-day advancing stock to declining stock ratio. And the other is based on the number of stocks hitting new 20-day highs. This is something we didn’t see in the previous lows this year, so that’s a good sign.
Overall, though, the bottom line is that the market is showing some signs of life, but our models will need to see more evidence shift to the positive side of the ledger before a more bullish outlook can be justified.
This is intended for informational purposes only and should not be used as the primary basis for an investment decision. Consult an advisor for your personal situation.
Indices mentioned are unmanaged, do not incur fees, and cannot be invested into directly.
Past performance does not guarantee future results.