OVERVIEW
The U.S stock market deteriorated last week as all three major stock indices posted declines. The S&P 500 index fell 2.21%, the Dow Jones Industrial Average declined 1.28%, and the Nasdaq Composite plummeted 4.13%.
Growth stocks led the decline, falling about 3.4%, versus the 1.2% decline for value stocks. Large-cap stocks fell around 2.6%, and small-cap stocks lost about 1.2% for the week.
Internationally, emerging market stocks outperformed developed market stocks. The MSCI EAFE index fell 2.23%, whereas the MSCI EM index declined 1.81%.
Treasury bonds prices rose as the yield on the 10-year Treasury note dropped to 2.9%, down from 3.1% the previous week. Long-term Treasuries gained 2.45%, intermediate-term Treasuries rose 1.27%, and short-term Treasuries increased 0.04%. While investment-grade corporate bonds rose 0.8%, high-yield (junk) bonds fell 1.63%. Municipal bonds gained 0.62%, and TIPS fell 0.23%.
Commodities had a rough week, falling around 3.45% broadly. Digging deeper, we see that oil rose 0.49%, gold dropped 1.57%, and corn plummeted 9.23%. The U.S. dollar strengthened nearly 1% for the week. And real estate dropped 0.4%.
KEY CONSIDERATIONS
Souring Outlook – Last Friday, the Wall Street bank JPMorgan Chase cut their economic growth outlook for the U.S. Their economists noted that their “forecast comes perilously close to a recession.”
And they weren’t the only ones souring on the economy. Several forecasters have lowered their economic outlooks in recent weeks after a slew of weaker data suggested the U.S. economy is slowing down.
Take the U.S. manufacturing sector, for example. Five of the twelve Federal Reserve Regional Districts publish monthly data on regional manufacturing: Dallas, Kansas City, New York, Richmond, and Philadelphia. These surveys measure local economic health and are typically representative of the larger national manufacturing sector.
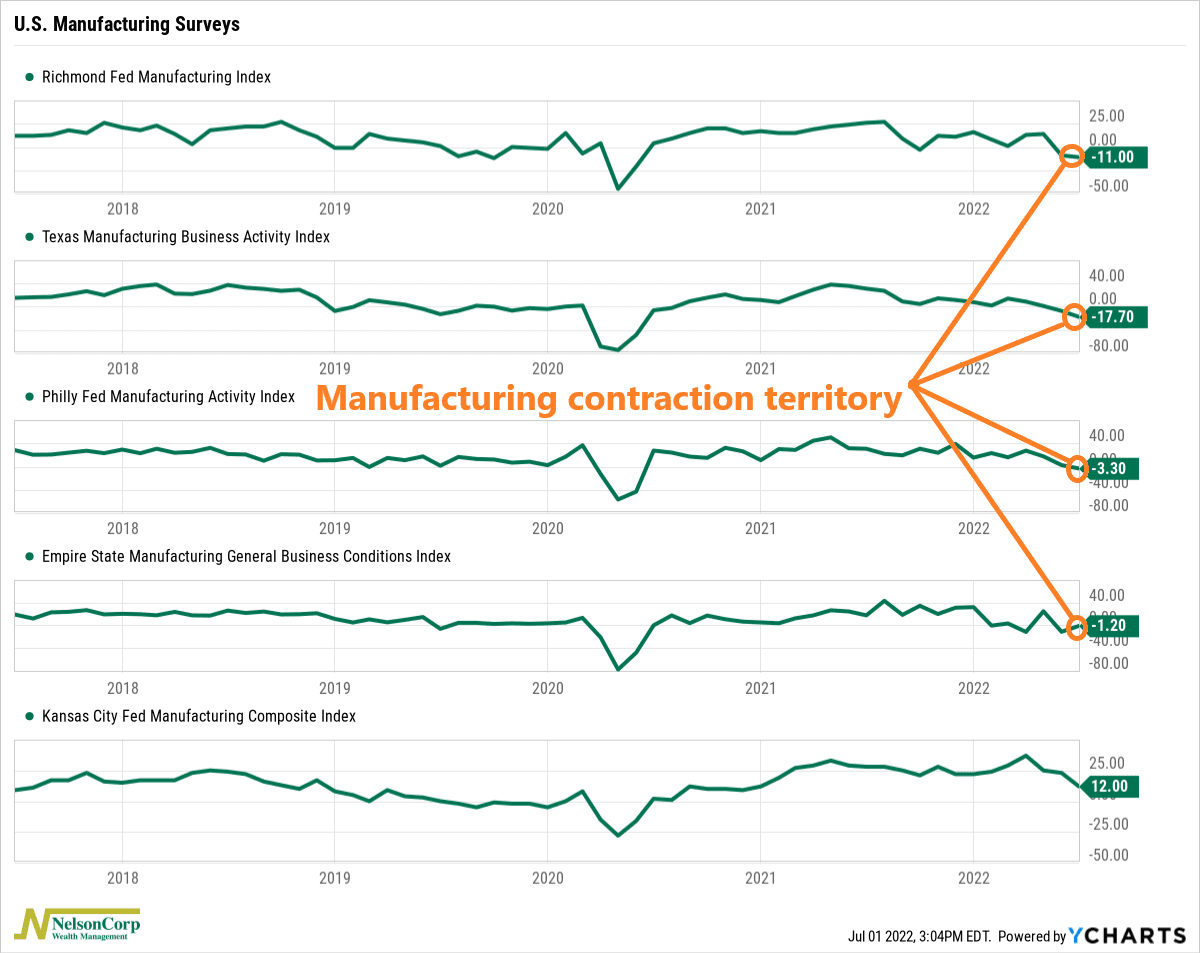
As the chart above shows, four of the five are currently in economic contraction territory (below zero). This is a sign that business activity mostly shrank across the nation last month. With retail inventories already elevated and order books thinning out, these surveys highlight the risk that production could slow down in the coming months.
Even more of a concern is the recent slowdown in consumer spending. Last week, we found out that inflation-adjusted personal spending declined in May for the first time this year.
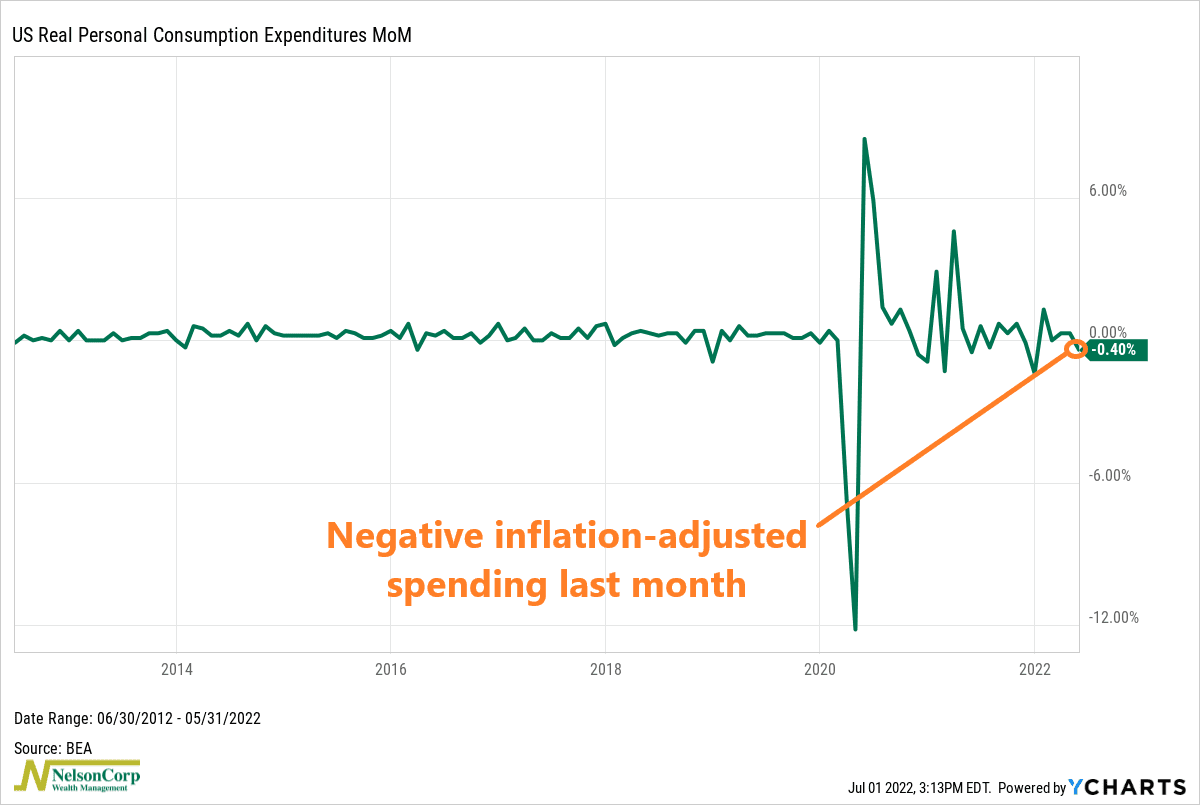
As the chart above shows, the latest reading for the U.S. Real Personal Consumption Expenditures (PCE) index was a decline of 0.4%.
Why is this concerning? Because consumer spending is by far the biggest contributor to U.S. economic growth; a decline in this area could spell trouble for the overall economy.
Sure enough, on Thursday, the Federal Reserve Bank of Atlanta’s GDPNow estimate was lowered to a 1% decline in GDP for the second quarter. More recent data have made the GDP estimate decline even further, to around -2%.
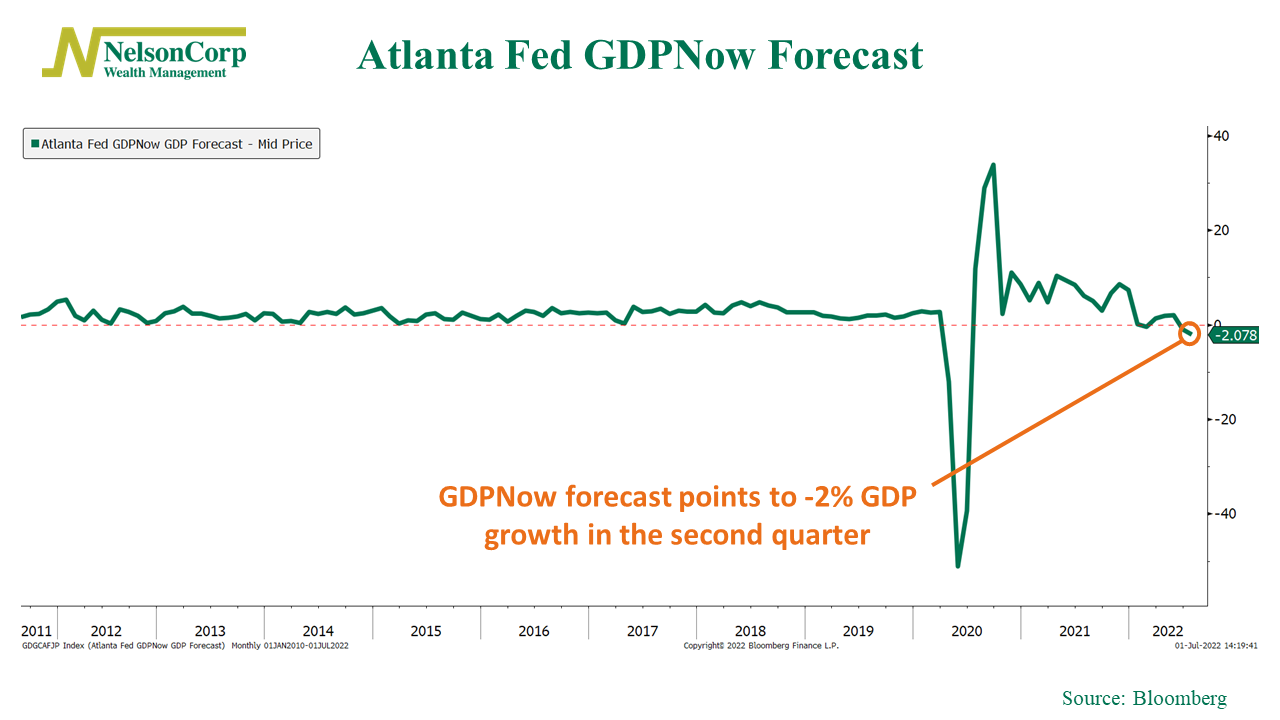
The GDPNow model is not an official forecast. Rather, it’s best viewed as a running estimate of real GDP growth based on economic data as it is released. So, as more economic data comes in worse-than-expected—which it mostly has been—the model’s growth estimate automatically gets lowered.
So, the data are pointing to an economic slowdown, perhaps even a recession. And while that could potentially lead to lower inflation and interest rates—which would be good for stocks—it will also likely hurt corporate earnings growth—which is generally bad for stocks.
For example, this last chart shows S&P 500 returns based not on the year/year change in Earnings Per Share (EPS) growth for S&P 500 companies but rather on the year/year growth rate. In other words, it shows the year/year change in the year/year change of earnings growth.
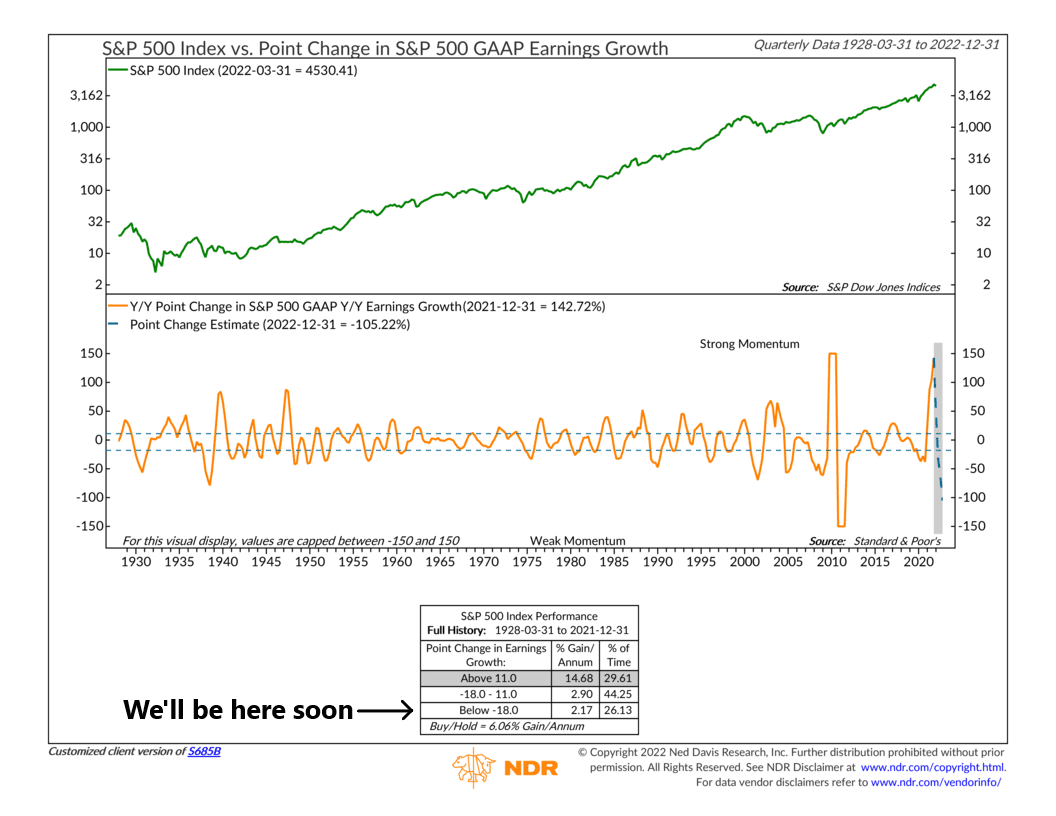
Currently, this indicator shows strong momentum in the growth rate of earnings. But it updates only quarterly. The latest estimates (shaded area) suggest that the indicator is set to fall from the upper zone (strong momentum) to the bottom zone (weak momentum) now that the second quarter is over. Historically, the S&P 500 has risen at a measly 2.2% annual rate when EPS growth is decelerating this quickly—something to keep in mind as we head into the second half of the year.
So, the bottom line is that the stock market will likely need to go through a period of further repricing if an economic recession scenario does come to fruition and corporate earnings come under pressure.
If, however, we do avoid a recession, corporate earnings remain intact, and a slight but less severe slowdown in economic growth manages to cool inflation, that would likely be a setup for better stock returns going forward.
This is intended for informational purposes only and should not be used as the primary basis for an investment decision. Consult an advisor for your personal situation.
Indices mentioned are unmanaged, do not incur fees, and cannot be invested into directly.
Past performance does not guarantee future results.