OVERVIEW
The S&P 500 index fell 2.26 percent last week, its largest weekly decline in nearly two months.
Energy, real estate, and financials were among the sectors hit the hardest. Of the 11 major S&P 500 sectors, only healthcare managed to post a positive return for the week.
Volatility perked up as the VIX index rose back above a reading of 30.
In the international space, declines were similar to U.S. stocks. Developed country stocks fell about 3.3 percent, and emerging market stocks fell 1.15 percent.
The yield on the U.S. 10-Year Treasury Note settled around 0.65 percent after starting the week at 0.69 percent.
Most bonds rallied across the board as a result of the lower interest rates, particularly longer-dated Treasuries. High-yield bonds, however, dropped about two-thirds of a percent.
Although oil and gold had big gains for the week, commodities were dragged lower by the negative returns from natural gas, cattle, grains, and industrial metals such as copper.
The U.S. dollar gained about 0.7 percent.
KEY CONSIDERATIONS
Stuck in the Middle – It’s been about three months since the stock market embarked on its coronavirus-induced sell-off. It took about a month for the S&P 500 index to drop roughly 34 percent from its late-February peak. The index then regained a chunk of those losses over the next month or so in an aggressive rally. This past month, however, the S&P 500 has been essentially flat, stuck in a congested zone.
We can see this visually by plotting two of the most common technical indicators watched by Wall Street: the 200- and 50-day moving averages.
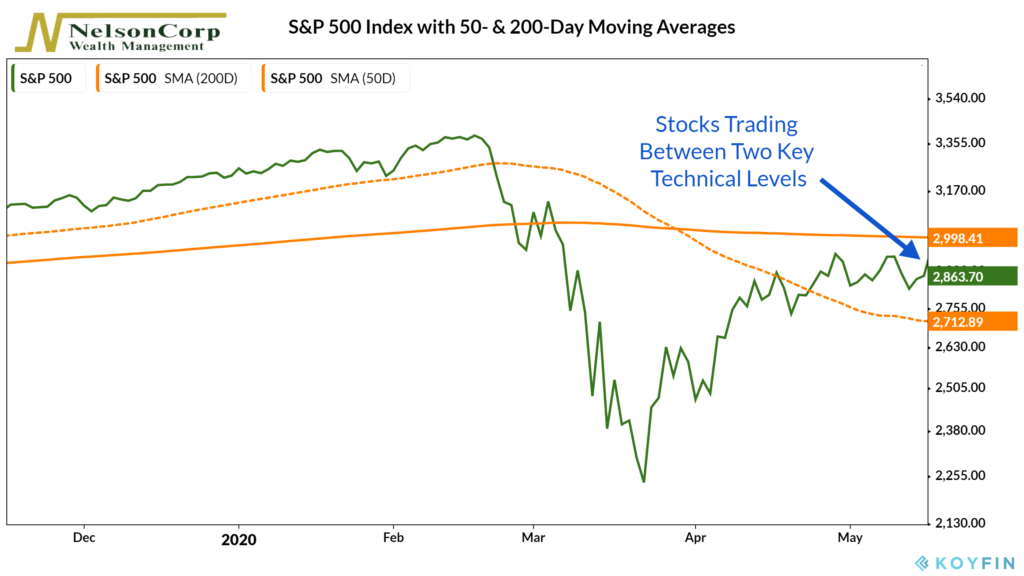
This first line, the 200-day moving average (solid orange line), represents the average closing price of the S&P 500 index over the past 200 trading days. With an average of 21 trading days in a month, this represents about 9.5 months of trading, making it an excellent gauge for the longer-term trend of the stock market.
On the other hand, the dotted orange line represents a moving average over a shorter time frame; in this case, it is 50-days or about two months of trading. As the chart shows, the stock index has stayed above the 50-day line since late April but has failed to surge above the longer 200-day line.
This state of being stuck between two key technical levels pretty much sums up the risk to stocks right now, which we define as more or less “neutral.”
“There’s really no limit…” – On Sunday night, 60 Minutes aired an interview with Federal Reserve Chairman Jerome Powell in which he laid out his views on the economy and its potential recovery.
In a nutshell, he affirmed that we are going to have a very sharp downturn, but that it will probably be much shorter than one you would associate with The Great Depression of the 1930s.
Why? Primarily because of the fast and aggressive lending from the Federal Reserve, as well as the fiscal response from the federal government. The U.S. government can currently borrow at a rate of about 0.7 percent for ten years, so now is the time to take advantage of those low rates, according to Powell.
He also emphasized that the Federal Reserve is not out of ammunition in what it can do to backstop the economy, and that “there’s really no limit to what we can do” with their lending programs.
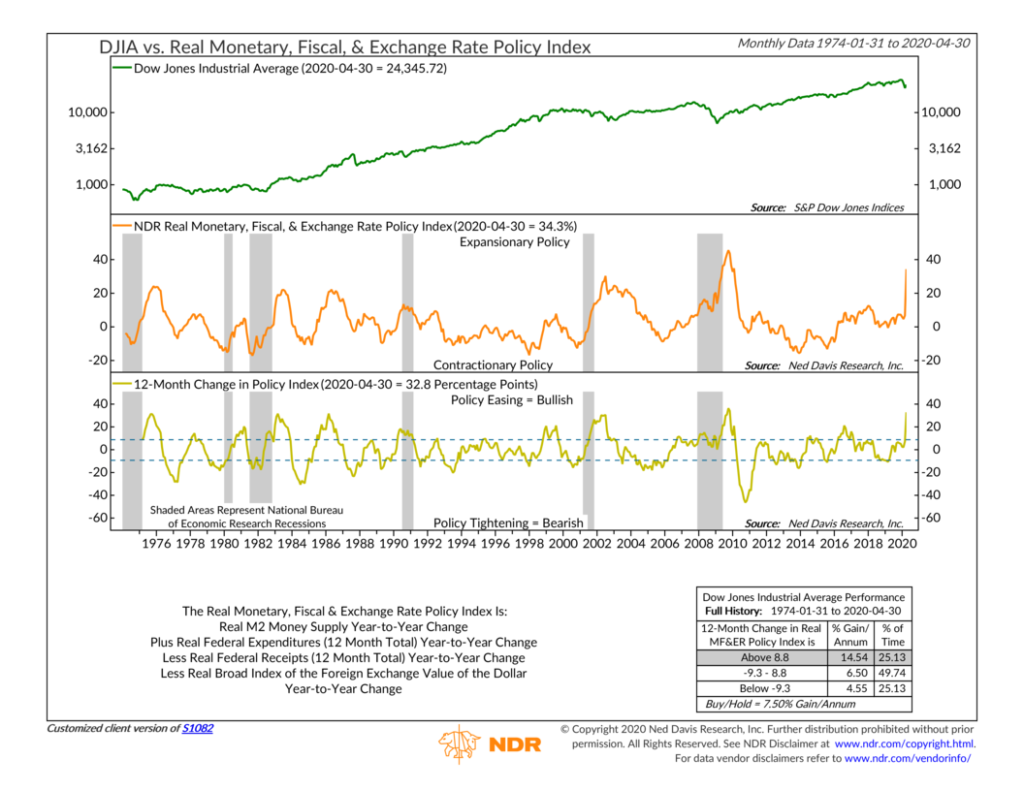
Indeed, an indicator that tracks just how “easy” monetary and fiscal policy is has turned very bullish. The year-to-year change in both the money supply and federal expenditures skyrocketed last month. Historically, risk-sensitive assets such as stocks have performed very well when fiscal and monetary policy is this expansionary.
This is intended for informational purposes only and should not be used as the primary basis for an investment decision. Consult an advisor for your personal situation.
Indices mentioned are unmanaged, do not incur fees, and cannot be invested into directly.
Past performance does not guarantee future results.