OVERVIEW
U.S. stocks saw substantial gains across the board last week, with every sector in the S&P 500 finishing in the black.
The S&P 500 Index rose 2.45 percent, the Dow Jones Industrial Average gained 3.8 percent, and the Nasdaq Composite finished the week 2.47 percent higher.
Developed country stocks rose about 1.9 percent for the week while emerging market stocks gained 0.96 percent.
The U.S. 10-Year Treasury Note yield ended the week around 0.57 percent, a slight tick higher from the previous week.
Long-term Treasuries dropped about half a percent due to the higher rates, but most other bonds managed to end positive for the week.
Commodities rose once again, spurred along by strong gains in gold and oil.
The U.S. dollar weakened for another week, down about a fifth of a percent.
KEY CONSIDERATIONS
Surveying the Land – Taking a step back and looking at the environment as it stands today, we see some strong tailwinds supporting the stock market.
First off, interest rates are near historic lows.
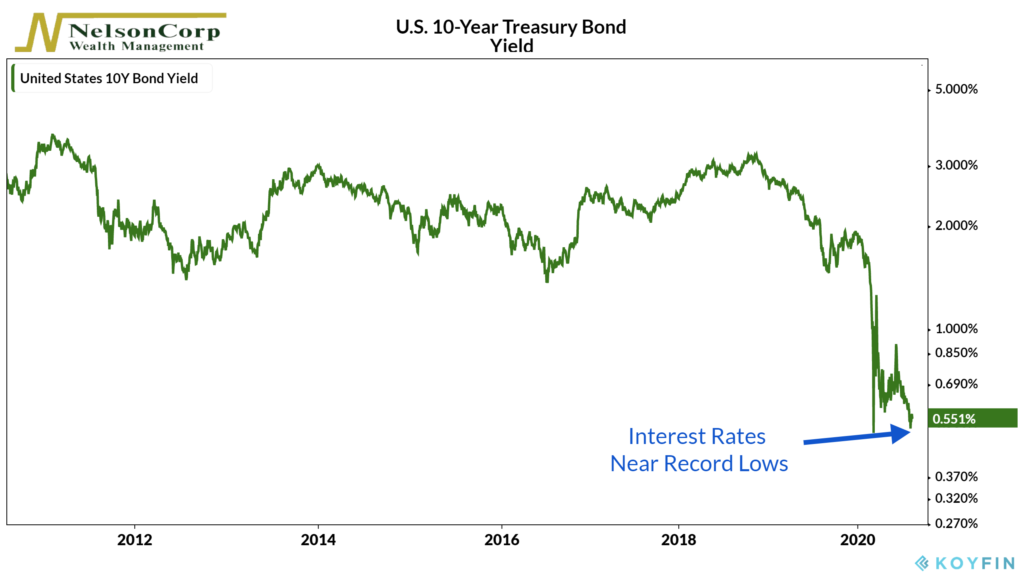
The 10-year government bond yield dropped precipitously when the crisis struck earlier this year and the Federal Reserve slashed short-term rates to zero. Bursts of volatility followed in the subsequent months. But after reaching nearly one percent in June, rates have fallen back near their lows, hovering around half a percent.
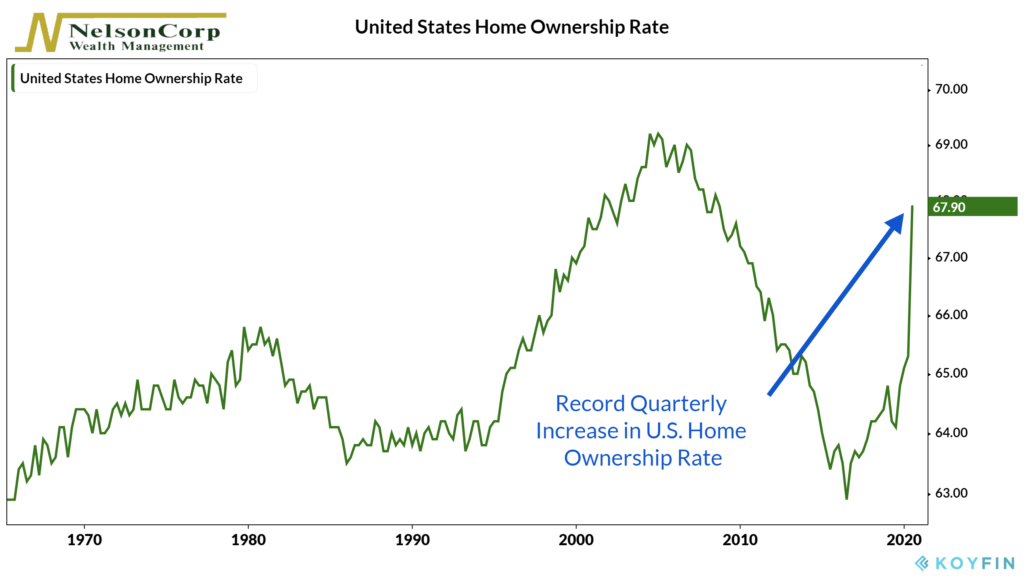
Falling rates are undoubtedly good for people looking to buy homes. The homeownership rate rose to 67.9 percent in the 2nd quarter, a record increase. Data showed a surge in homebuilder confidence, home construction, and both new and previously owned homes in the past few months.
But falling rates are also good for the stock market, particularly interest-rate-sensitive financial stocks.
In general, these rate-sensitive stocks tend to lead the broader stock market. We look at the AMEX Securities Broker/Dealer Index to track these types of stocks. And sure enough, the index has recently risen to a level that is historically bullish for the S&P 500 Index.
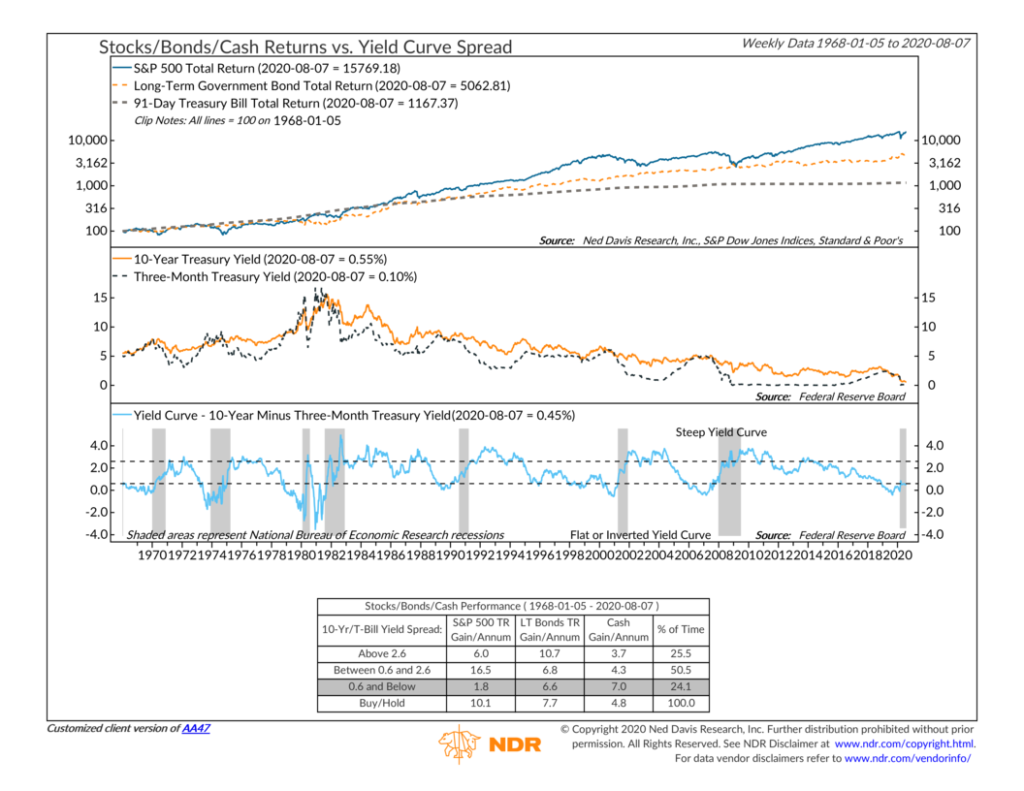
So low rates are helping, but what about the yield curve?
This area is less benevolent. By yield curve, I mean the 10-year government bond rate minus the 3-month government bond rate. Currently, the spread is a meager 45 basis points. Historically, stocks tend to underperform both cash and bonds when the spread is below 60 basis points.
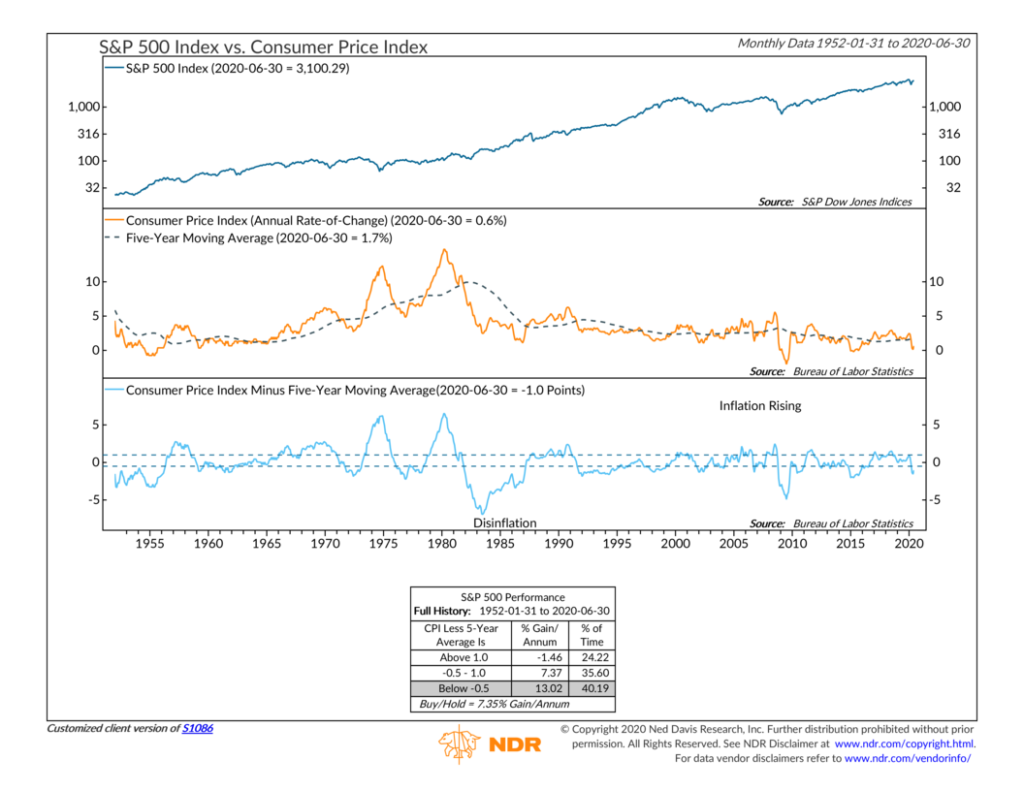
The good news, however, is that inflation is at low enough levels that stock market returns still look favorable going forward.
How do we quantify this? Historical analysis shows that when the year-to-year rate of inflation relative to its 5-year average is below 0.5 percent, the S&P 500 Index does exceptionally well. It returns roughly 13 percent on an annualized basis when this is the case, compared to its buy-and-hold average of about 7.3 percent.
So, overall we see a sufficiently bullish environment for stocks at the moment. While there are always risks, our philosophy guides us to stay on the right side of the market until the weight of the evidence shifts in the other direction.
This is intended for informational purposes only and should not be used as the primary basis for an investment decision. Consult an advisor for your personal situation.
Indices mentioned are unmanaged, do not incur fees, and cannot be invested into directly.
Past performance does not guarantee future results.