OVERVIEW
The U.S. stock market, as measured by the S&P 500, fell back into correction territory (10% off its highs) last week with a -2.88% weekly decline. The Nasdaq fell even harder, declining around 3.5%. And the Dow, which registered its fifth straight weekly decline, lost another 2% for the week.
Returns were more mixed for international stocks. The MSCI EAFE index of developed country stocks rose 0.42%, whereas the MSCI EM index of emerging market stocks tumbled more than 5% on the week.
Investors found no refuge in bonds, either. The yield on the benchmark U.S. 10-year Treasury note rose from 1.73% to 1.99% over the course of just five days. This resulted in intermediate- and long-term Treasury losses of around 1.7% and 3.95%, respectively. Investment-grade corporate bonds declined 2.7%, and high-yield (junk) bonds decreased 1.5%. TIPS, however, rose about 0.5%.
Commodities took a breather, declining about 0.5% for the week. Oil dropped 3.85%, gold rose 1.06%, and corn increased 1.4%. Real estate fell around 1.5%. And the U.S. dollar rose about 0.6%.
KEY CONSIDERATIONS
Technically Speaking – This week, I want to talk about the technical health of the stock market.
In other words, let’s put aside all the external factors for a second—geopolitical, the Fed, interest rates, valuations, etc.—and just focus on the price movement of the stock market itself.
Most people start with the trend when they talk about the technical health of the stock market. As the name suggests, the trend simply measures the general direction that stock prices seem to be moving over a given period.
Two hundred trading days (roughly 9 nine months) is one of the most common time frames that investors tend to use when measuring the stock market’s intermediate- to long-term trend.
So, on the chart below, we plot the S&P 500 stock index (green line) along with its 200-day moving average (gold line).
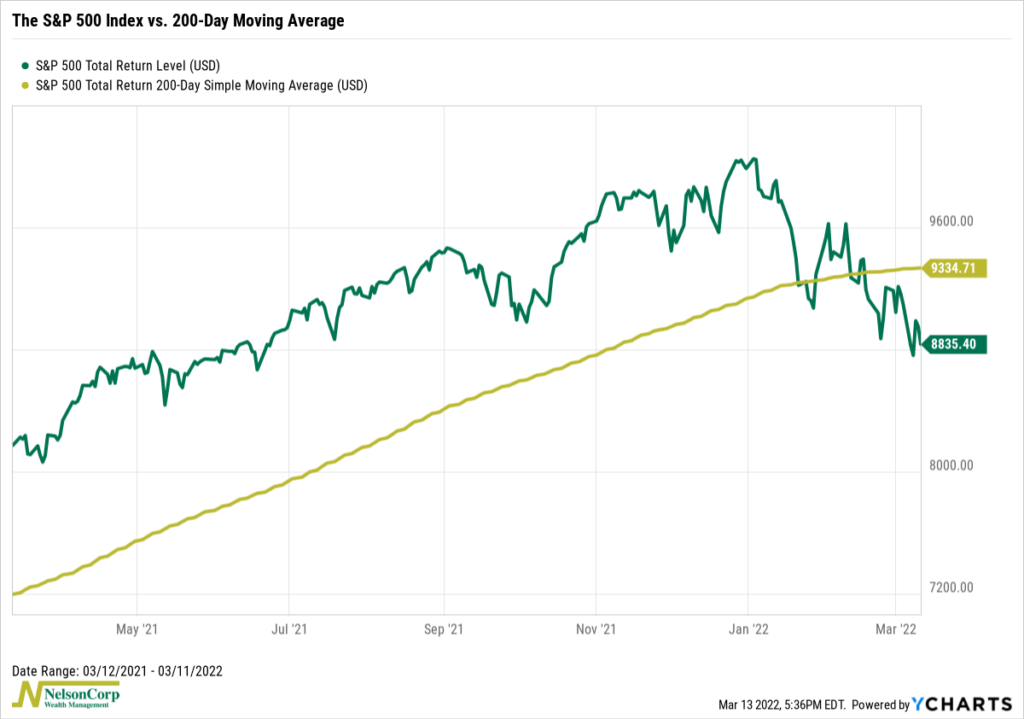
Currently, the S&P 500 is trading roughly 5% lower than its 200-day average price. That’s not an encouraging sign.
Furthermore, while the 200-day average price is still technically rising, it’s only about 0.05% higher than five days ago. It could turn negative any day now.
All of this suggests that the stock market’s trend has weakened significantly over the course of this year.
Below is the same analysis but applied to the Nasdaq 100 stock index, which comprises the 100 largest non-financial companies listed on the Nasdaq stock exchange.
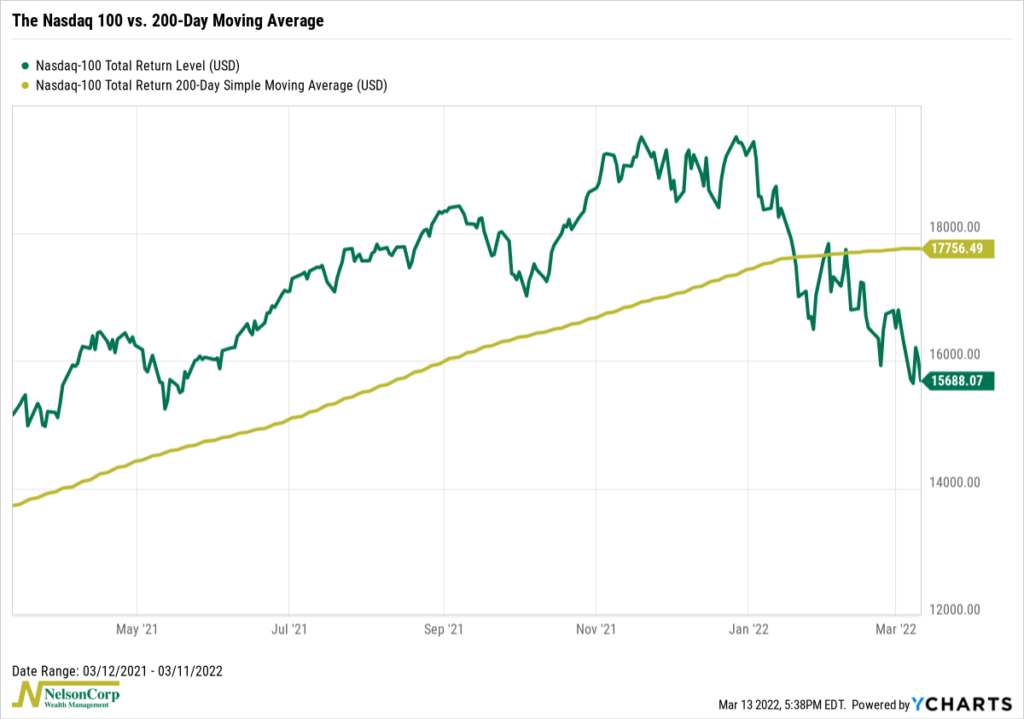
Here the situation is even worse.
The index is currently trading roughly 11.5% below its average 200-day price, and as of last Friday, the 200-day average price is now falling relative to where it was five days ago.
So, based on this trend evidence, it’s clear that the stock market is feeling, at the very least, under the weather—if not outright ill.
With that said, however, we do see some signs that the market may be attempting to get better.
The chart below shows our Overbought/Oversold Composite. It combines six different overbought/oversold indicators into one reading, which then feeds into our overall model.
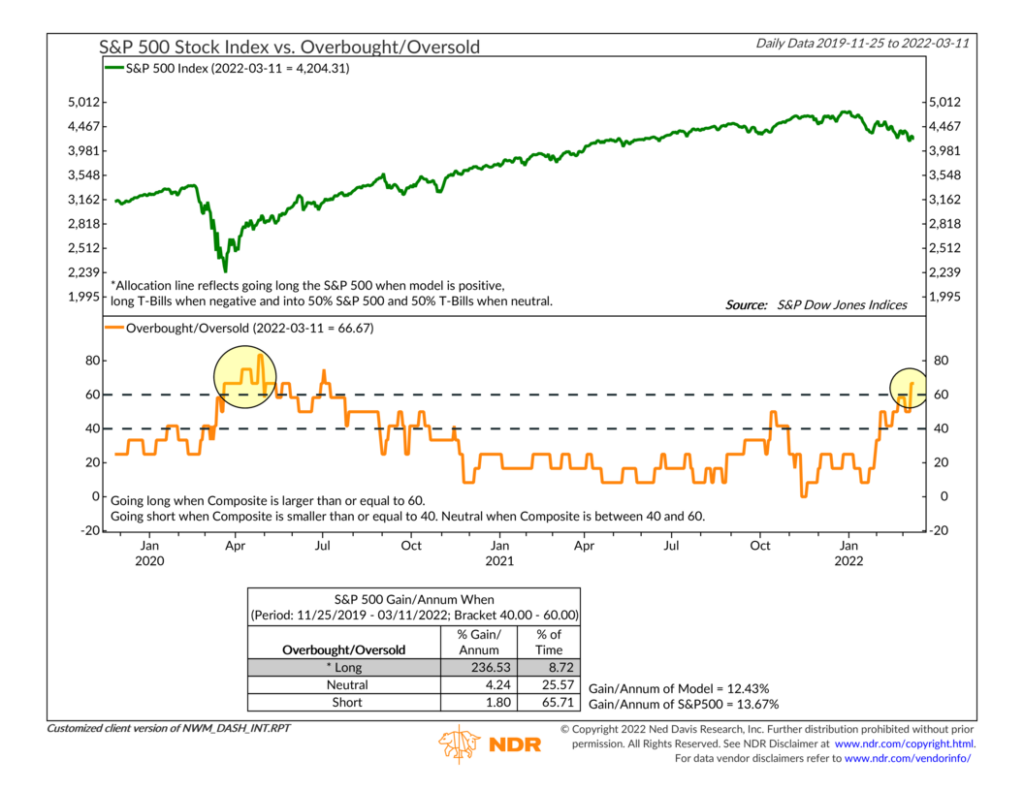
Last week, it rose above the upper (bullish) bracket line, indicating that the market is reaching oversold levels.
I highlighted the last time it rose this high, which happened near the bottom of the selloff in March 2020. Stocks ripped higher after that timely oversold signal.
Of course, I’m not implying that the same thing will happen this time around. History is only a guide.
But, from a technical perspective, things are starting to look oversold to the downside, and this is flowing into our overall model as a positive input.
To be sure, it’s not enough to get the model into a positive zone, given the negative headwinds from the deteriorating trend discussed above. But it is enough to keep our overall model from getting too negative.
Overall, then, our model suggests that the market is mainly in a neutral state of health. There are some signs of improvement, particularly in the oversold area of our analysis. But the market will still need to prove itself further from a trend/momentum perspective before we can be confident that it is no longer sick.
This is intended for informational purposes only and should not be used as the primary basis for an investment decision. Consult an advisor for your personal situation.
Indices mentioned are unmanaged, do not incur fees, and cannot be invested into directly.
Past performance does not guarantee future results.