OVERVIEW
U.S. stocks rose for a second straight week last week. The S&P 500 Index gained 2.67%, the Dow Jones Industrial Average rose 2%, and the tech-focused Nasdaq Composite surged 4.82%.
Foreign stocks had a strong week as well. The MSCI EAFE Index of developed country stocks increased 4.24%, and the MSCI EM Index of developing country stocks rose 4.16%.
Bonds joined the party, too, as the 10-year Treasury yield fell to 3.5%. Intermediate-term treasuries rose 0.6%, and long-term Treasuries gained 1.54%. Investment-grade corporate bonds increased 1.4%, and high-yield (junk) bonds rose 1.58%. TIPS gained about 0.25%.
Not to be outdone, commodities surged about 3.2% overall. Specifically, oil gained 8.05%, gold increased 3.68%, and corn rose 3.2%. Real estate gained around 4.5%, and the U.S. dollar weakened about 1.5%.
KEY CONSIDERATIONS
Test Time – After a second week of gains, the S&P 500 Index is again in familiar territory.
By that, I mean that the index is back to testing two key technical levels: its long-term trendline and its 200-day moving average—both shown on the chart below.
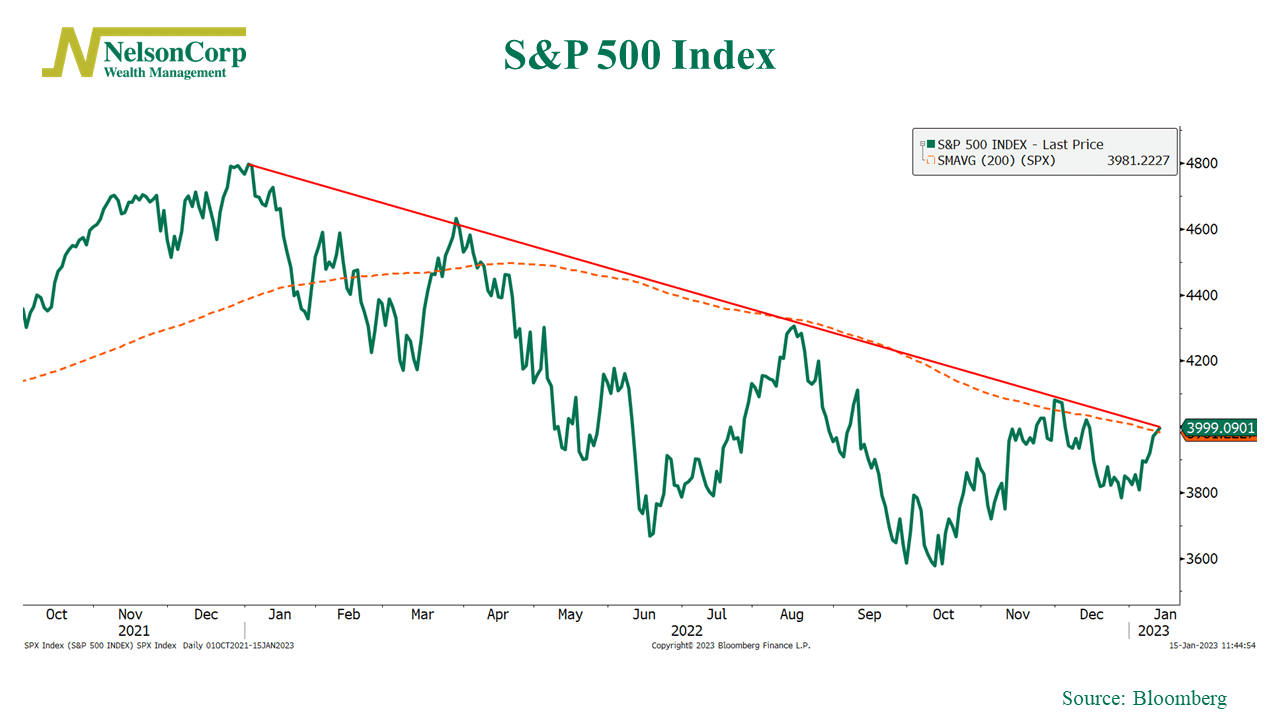
The last few times the S&P 500 tested these levels, it was hit with what we call “resistance.” In essence, this means that a lot of selling tends to occur here, so it acts as a resistance to higher prices.
There is nothing magical about these price levels, but the psychology driving these trends can be significant—so it’s worth paying attention to. The market failed to break through these psychological barriers last year; will this year be different?
One area that would help is if we saw some improvement in breadth. In general, the overall stock market tends to perform the best when more of the individual stocks comprising the market indexes are doing well.
For example, the indicator below uses what is called a high-low logic index to measure market breadth based on new highs and lows. Specifically, it sums the lesser of new highs or new lows and divides that by the total issues traded on the major stock exchanges.
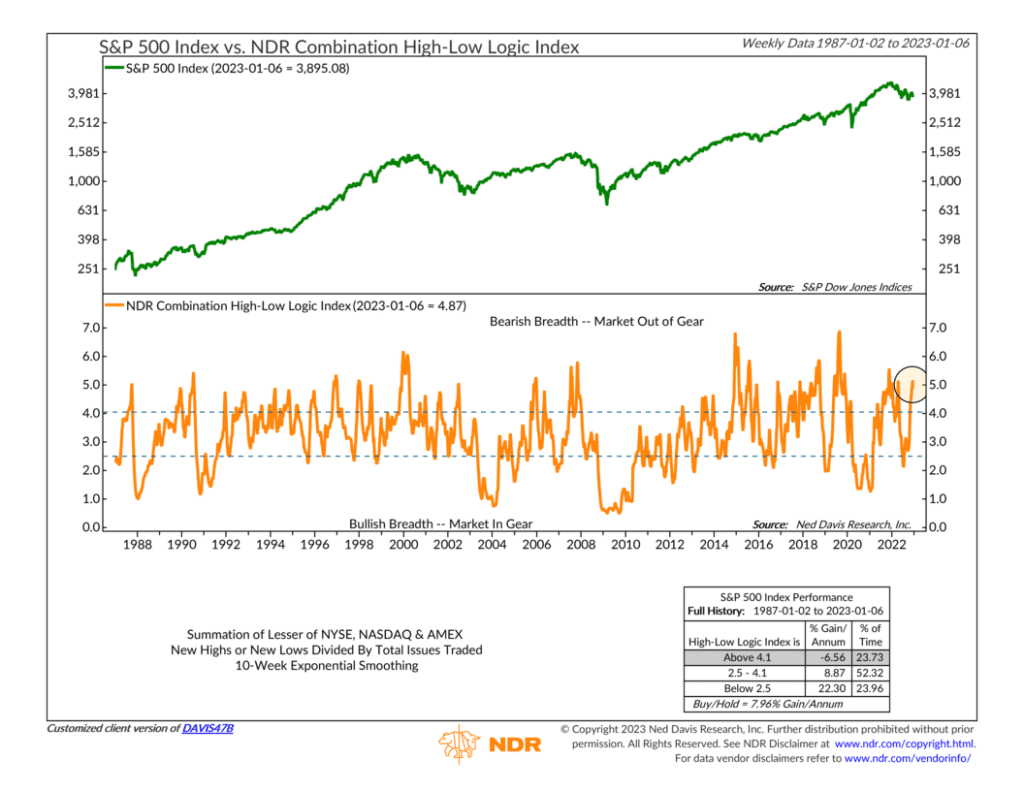
When the indicator is high and in the upper zone—like it is now—it means there are a lot of new highs but also a lot of new lows. We call this an “out of gear” market, which has historically been a poor situation for the stock market.
In other words, in a healthy market, the new lows fade away, and the new highs take over, sending the high-low logic index lower. This just hasn’t happened. So, it’s hard to say that the underlying breadth of the market is healthy at the moment.
But this could change. Looking at a high-level view of our Price Movement Model, shown below, our price-based indicators have improved at the composite level rather quickly to start the year.
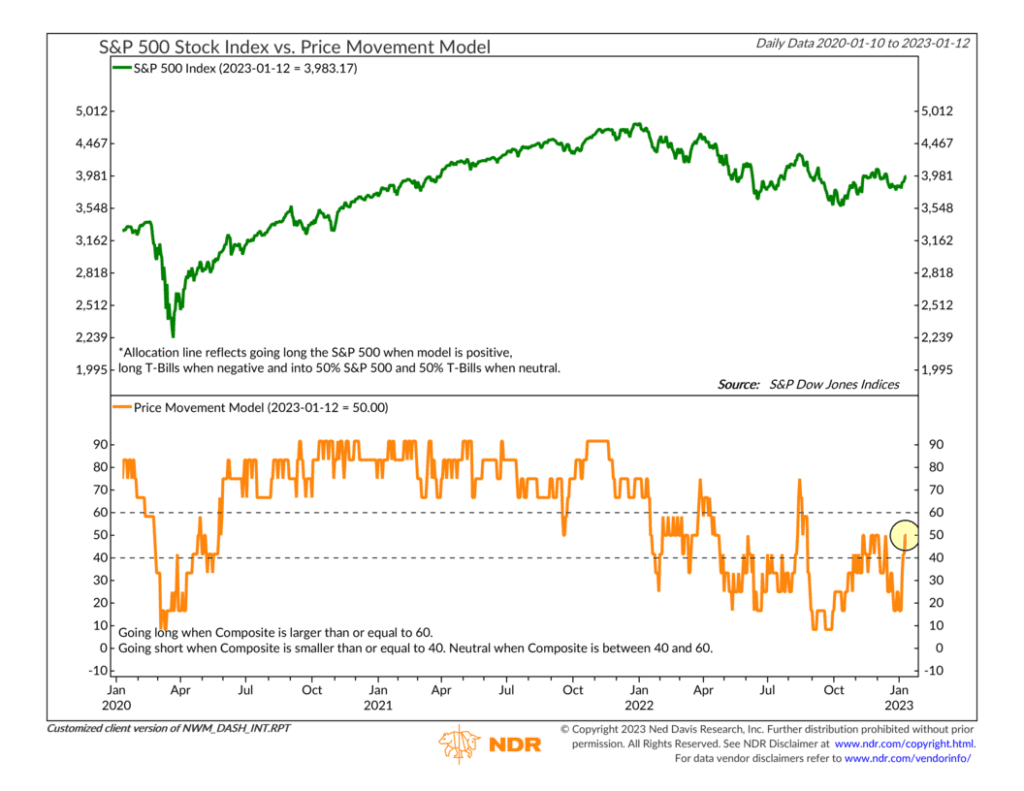
Right now, the overall reading is exactly “neutral” at 50%. If this model can get into the upper bullish zone and stay there for a sustained period, that would likely mean that the stock market has finally found its legs. That could help fuel a market rally if conditions stay right.
This is intended for informational purposes only and should not be used as the primary basis for an investment decision. Consult an advisor for your personal situation.
Indices mentioned are unmanaged, do not incur fees, and cannot be invested into directly.
Past performance does not guarantee future results.