OVERVIEW
The U.S. stock market saw substantial gains in the Nasdaq Composite last week, rising 2.65 percent.
The S&P 500 did less well but still rose about 0.72 percent.
The Dow Jones Industrial Average, however, remained exactly flat for the week.
Large-cap, growth stocks led the rally, spurred by the 3.6 percent gain in the technology sector.
International stocks did less well. Developed country stocks dropped 1.03 percent, and emerging market stocks ticked down by about 0.12 percent.
After a bit of a sell-off the past couple of weeks, Treasury yields ticked back down, and prices rose. The yield on the 10-year Treasury note settled around 0.64 percent by the end of the week.
As for the returns on real assets, real estate fell about 0.4 percent. Gold also ticked lower for the week. However, corn and crude oil prices saw decent weekly gains.
The U.S. dollar ended the week mostly where it started, dropping just a few basis points.
KEY CONSIDERATIONS
Up, Up and Away – I had to do something this week that generally only occurs during a strong up-trend in a bull market: I added more room to the top of the charts in our primary stock market risk model.
Indeed, the stock market’s snapback from the sell-off earlier this year has been quite strong, and the overall level of our risk model is spitting out readings that haven’t been this bullish in years.
Coming in on top is the price movement of the stock market itself, which is the strongest of the three main categories that make-up the risk model. While there are a few weak areas, momentum remains strong, and we see enough participation globally to keep the weight of the evidence on the positive side.
The economic component of the model is much weaker but still on a positive signal. We’ve seen enough improvement in some of the economic data lately to warrant this reading. Of course, the massive fiscal and monetary response from Congress and the Federal Reserve has really eased the burden of much of this downturn.
Still, the Gross Domestic Product (GDP) of the U.S. economy dropped dramatically in the past quarter. And stocks soared in the opposite direction. The result: a record increase in the total market capitalization of the U.S. stock market relative to the nation’s GDP.
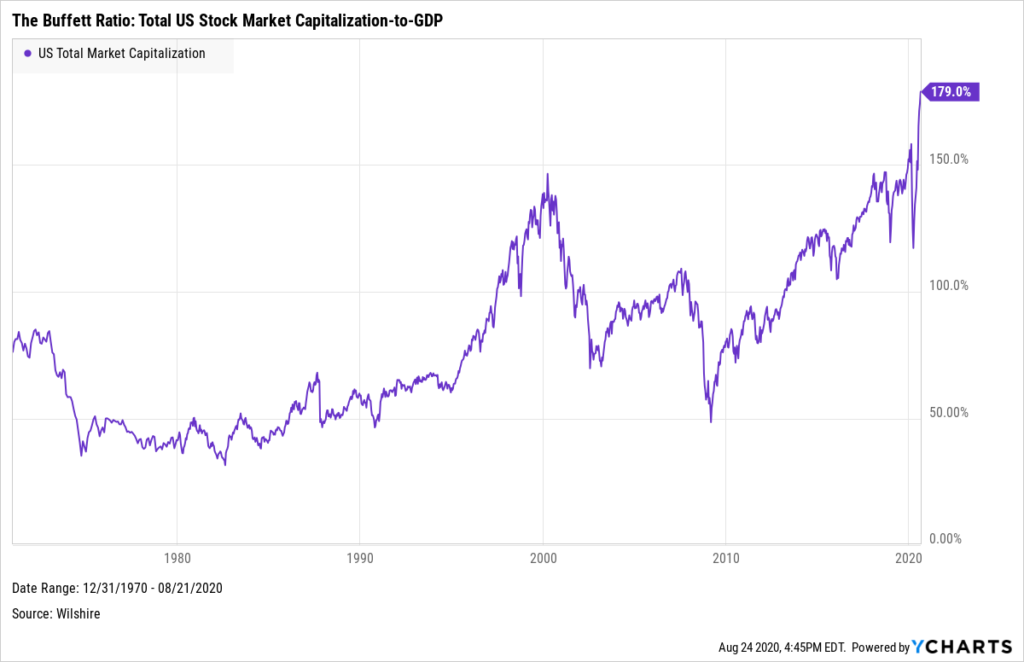
This is the so-called Buffett Ratio, named after the famous investor Warren Buffett, who once said that it was “probably the best single measure of where valuations stand at any given moment.”
At nearly 180 percent, the total market capitalization of the U.S. stock market is now at the highest level it’s ever been relative to the underlying economy.
So maybe stocks have gotten overvalued, and the weight of their own gravity will bring them down from these levels. That’s possible.
But it’s also possible that stocks are pricing in a future economic recovery that brings GDP back up and the Buffet Ratio back down to less overvalued levels.
In the end, it’s best to listen to the weight of the evidence and invest based on probabilities, not possibilities.
The investor Martin Zweig perhaps said it best: “Some people think you must buy at the bottom and sell at the top to be successful in the market. That’s nonsense. The idea is to buy when the probability is greatest that the market is going to advance.”
This is intended for informational purposes only and should not be used as the primary basis for an investment decision. Consult an advisor for your personal situation.
Indices mentioned are unmanaged, do not incur fees, and cannot be invested into directly.
Past performance does not guarantee future results.