OVERVIEW
The U.S. stock market, as measured by the S&P 500 index, rose nearly 1.5 percent last week and posted its fourth straight week of gains. Growth and large-cap stocks led the advance, gaining around 1.7 percent each.
International stocks also rose but to a lesser extent than U.S. stocks. Developed market stocks gained 1.16 percent, and emerging market stocks rose 1.29 percent. However, the U.S. stock market continues to outpace the rest of the world as investors remain willing to pay a premium for domestic assets.
Most bonds had positive returns, but the most significant gains centered around long-term Treasury and investment-grade bonds, which rose 1.48 and 0.55 percent, respectively.
The Bloomberg Commodity Index rose nearly one percent on the back of decent gains in the price of corn and gold. The U.S. dollar slid about half a percent and is now just barely positive for the year.
KEY CONSIDERATIONS
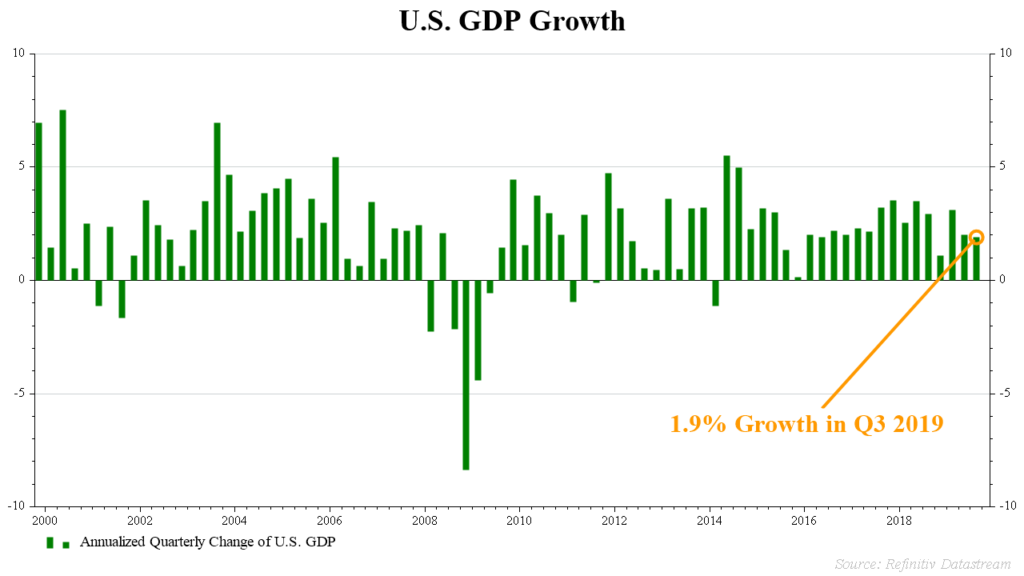
When Weak Economic Growth Is Bullish For Stocks – The Commerce Department revealed last week that the U.S. economy grew at a 1.9 percent annual rate in the third quarter, a good but not great growth rate, especially when compared to earlier this year.
At first glance, it seems reasonable to expect that weaker economic growth goes hand in hand with lower returns in the stock market. In most cases, this is indeed a reasonable assumption. After all, the stock market represents what people are willing to pay for the ownership claims on the companies that make up a large chunk of the economy.
However, in harmony with the strategy made famous by the German mathematician Carl Jacobi, we should always invert, or flip, a situation upside down and look at it another way.
If economic growth gets too high relative to the money supply, the rapidly growing economy sucks liquidity away from financial assets, putting downward pressure on the stock market. Indeed, many of the major downturns in the stock market in the past occurred when economic growth outstripped liquidity (money supply) growth.
To measure this level of excess liquidity growth, we look at the annual growth rate in the M2 money supply minus the yearly growth rate of industrial production and the commodity price component of the Producer Price Index (PPI). This indicator shows how much money is available for spending relative to the economy and what it produces.
After bottoming in the third quarter of last year, this measure started climbing steadily higher. A bullish signal was triggered earlier this year when liquidity growth rose above 1.5 percent; it is now nearly nine percent and trending higher. What this essentially tells us is that the Federal Reserve has provided enough liquidity to sustain the bull market, above what is needed for economic growth and inflation.
Volume Demand > Supply – So there is enough money sloshing around in the financial markets, but are investors using that money to push stock prices higher?
To measure this, we use what is called a breadth indicator. In this case, we focus on the 10-day total of the number of stocks advancing in price (Volume Demand) relative to the 10-day total of the number of stocks declining in price (Volume Supply).
Currently, Volume Demand is outstripping Volume Supply by around 2.4 percent. This is a good-sized margin that has been widening lately, suggesting that investors are enthusiastic about the stock market.
On average, periods of strong breadth generally indicate a shift in market momentum and further gains in stock prices. This bullish reading is thus encouraging for stock investors.
This is intended for informational purposes only and should not be used as the primary basis for an investment decision. Consult an advisor for your personal situation.
Indices mentioned are unmanaged, do not incur fees, and cannot be invested into directly.
Past performance does not guarantee future results.