OVERVIEW
U.S. stocks rose yet another week, as the S&P 500 climbed 0.85 percent. The Dow Jones Industrial Average and the Nasdaq Composite did even better, gaining 1.22 and 1.06 percent, respectively.
Although growth and small-cap stocks did well last week, value and large-cap stocks were the primary drivers of the rally.
Emerging market stocks posted substantial gains of about 1.5 percent. However, developed country stocks rose about half a percent, lagging the other major indices.
Bonds, on the other hand, took a beating as the yield on the U.S. 10-year Treasury Note rose to 1.942 percent (bond prices fall as yields rise). Only high yield (lower quality) bonds managed to squeak out positive weekly gains.
Commodities also edged lower due to a pullback in corn and gold. The U.S. dollar, however, had a good week, gaining over one percent.
KEY CONSIDERATIONS
Financials Testing All-Time Highs – The financial sector of the S&P 500 is once again bumping up against its historic all-time highs set in 2007. It first tested these highs at the beginning of 2018 but ultimately failed to breakout and fell precipitously to end the year. However, financials have rallied steadily this year and are hitting new 52-week highs.
Why is this important? Well, a strong, healthy financial sector is indispensable to a properly functioning economy.
As one of the largest segments in the S&P 500, the financial industry includes banks, insurance companies, investment houses, mortgage lenders, real estate brokers, and all the other financial institutions that help keep Main Street functioning properly. For this reason, the overall health of the economy is fundamentally reliant on the financial sector.
The importance to investors, however, is the fact that the financial sector tends to lead the broader market. For example, the S&P 500 Financials Index began falling at a quicker pace than the broader S&P 500 Index near the end of 2007. As the gap widened in 2008, stocks fell out of bed, and the financial crises ensued. As the financial sector started accelerating again in 2009, the broader market recovered, and the new bull market began.
We illustrate this dynamic between the financial sector and the broader market by measuring their performance over the past 150 days.
It’s sort of like watching two cars race down the highway: as one car begins to accelerate away from the other, a divergence occurs; a line representing this gap is then plotted on a graph.
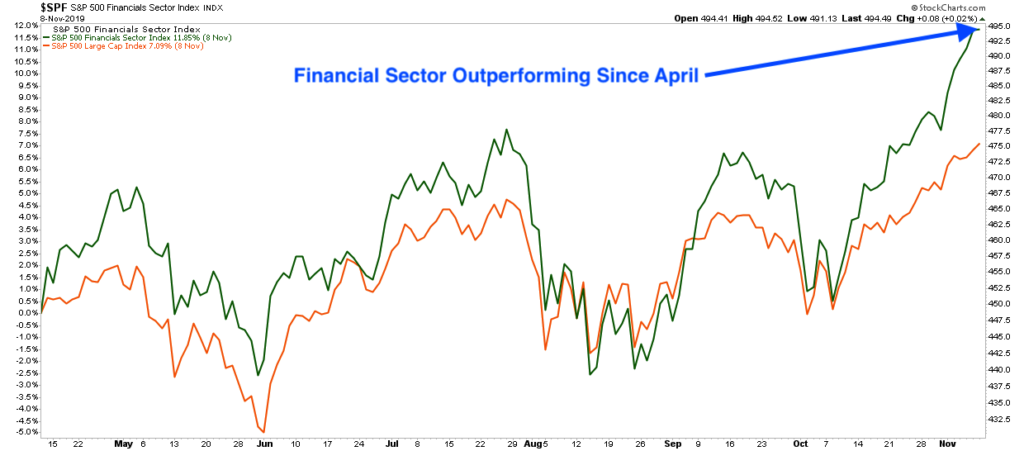
Last week, we saw the financial sector’s return over the past 150 days climb to almost 12 percent, whereas the broader market was around 7 percent. If this momentum continues, the financial sector could very well break above its previous record high.
History suggests the broader market will likely follow it higher if it does.
Monitoring Overbought Levels – Of course, we get concerned if momentum gets too high, raising the risk of the market becoming overbought.
We see this visually by looking at the Relative Strength Index (RSI), initially developed by the market technician J. Welles Wilder.
The calculation is a bit complicated, but ultimately this indicator measures the speed and change of price movements by oscillating between a reading of zero and 100. When it rises above 70 for an extended period, the market is considered overbought.
![]()
As of last Friday’s close, the S&P 500 had just barely risen above 70 on the 14-day RSI. As of this writing, it has fallen back below 70. This is telling us that although momentum is indeed rising and near its upper range, it hasn’t become too excessive.
More so, the RSI can continue giving overbought warnings throughout a strong uptrend, which appears to be forming. Maybe this rally has more room to run?
This is intended for informational purposes only and should not be used as the primary basis for an investment decision. Consult an advisor for your personal situation.
Indices mentioned are unmanaged, do not incur fees, and cannot be invested into directly.
Past performance does not guarantee future results.