OVERVIEW
The U.S. stock market finally took a breather last week after rising for six straight weeks. The S&P 500 Index dropped about a third of a percent to end the week, and the NASDAQ Composite dropped a quarter of a percent.
Developed country stocks did worse than the U.S. stock market last week, dropping about 0.6 percent. Emerging market stocks, however, were virtually flat. Over the past three months, emerging market and developed country stocks are outperforming the U.S. by a slight margin.
Long-term Treasury bonds had solid gains last week as interest rates edged lower. High yield bonds, however, fell nearly a quarter of a percent.
Commodities fell about a third of a percent last week as the price of gold and corn fell, but oil edged higher. The U.S. dollar strengthened relative to a majority of the major currencies last week.
KEY CONSIDERATIONS
The Big MACD Rolls Over – U.S. stocks have been on a roll lately, gaining more than nine percent over the past three months.
Despite the recent slew of weak economic data, the release last week showed that S&P 500 revenues remained in positive territory in the third quarter.
In general, company fundamentals remain strong, and the trend in stock prices is still to the upside.
However, we did see a slowdown in stock price momentum last week. The Moving Average Convergence/Divergence oscillator (MACD) is a tool that is commonly used to measure both the trend and momentum in stock prices.
MACD looks at a shorter-term moving average and compares it to a longer-term moving average. Momentum is estimated based on how far apart these two averages are.
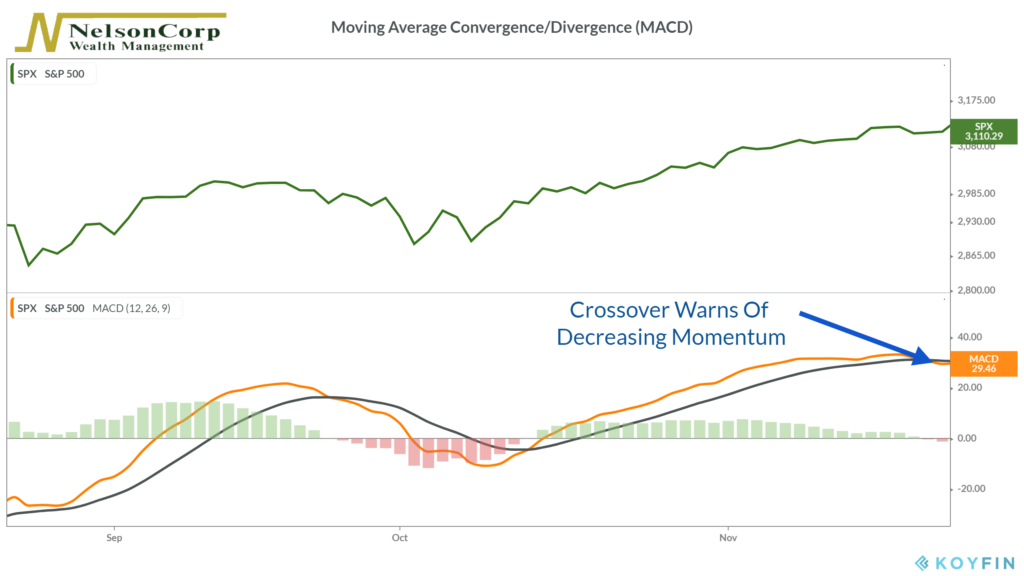
As seen in the graph, the shorter-term moving average (orange line) crossed below the longer-term moving average (black line) last week. This can be a sign that the bears are taking control of the price action.
While the deterioration in the MACD indicator is noteworthy, it doesn’t necessarily mean a price reversal is imminent.
Many times, a brief consolidation period after a sharp move upwards is a sign of trend strength.
Thus, due to the uncertainty inherent in any indicator, we don’t make investment decisions based on just one signal.
These indicators don’t happen in a vacuum, and sometimes there are larger forces at work in the market, which brings us to our next topic.
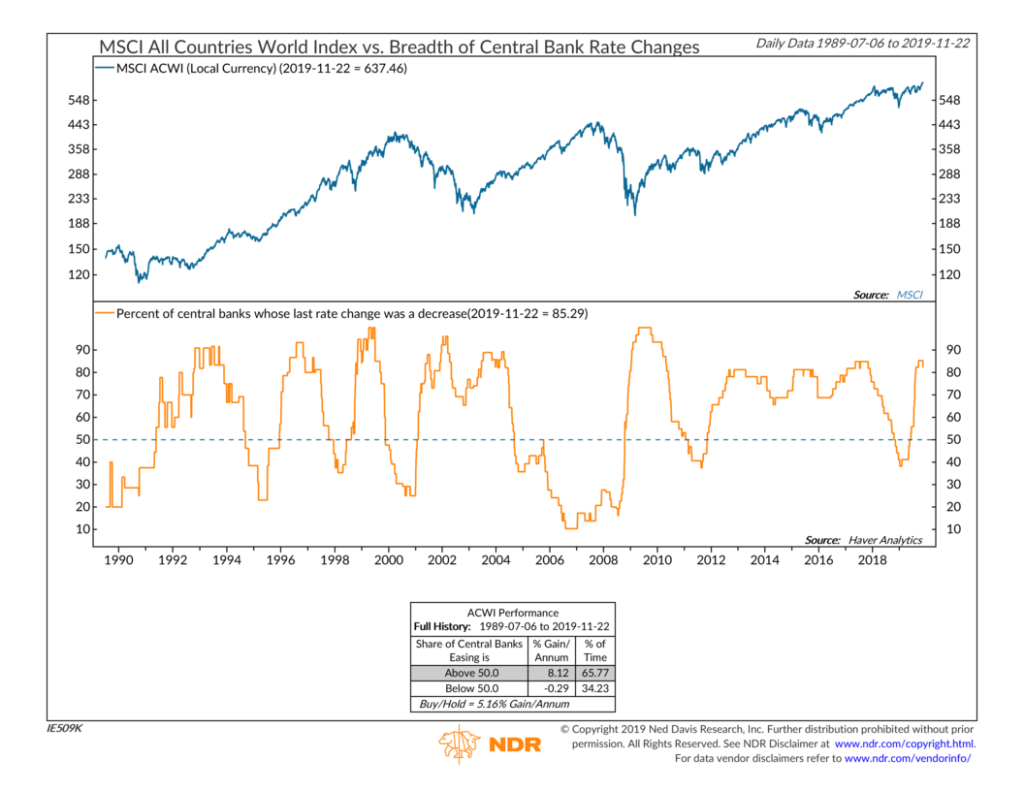
Friendly Central Banks – Central banks are the 800-pound gorillas of the investing world. When they move, people pay attention.
When central banks want credit to be cheap and easily obtained, they work to keep interest rates low. Low interest rates are generally good for stock prices.
Therefore, if central banks around the world are engaging in easy monetary policy, we should expect global stocks to do well.
This is, in fact, what we see historically. Since the early 1990s, virtually all of the global stock price gains have occurred when a majority of the central banks around the world were easing.
Currently, about 82 percent of central banks decreased their policy rate at their most recent meeting — a positive signal for stocks.
There is a common saying on Wall Street that you shouldn’t “fight the fed,” meaning it isn’t wise to make bold bets against the tide when central banks are trying to influence the monetary environment. They are a powerful force that should be taken into account in any investment strategy.
Therefore, a more conclusive downturn in a variety of other price-based indicators would need to occur before a reduction in stock allocations is warranted.
This is intended for informational purposes only and should not be used as the primary basis for an investment decision. Consult an advisor for your personal situation.
Indices mentioned are unmanaged, do not incur fees, and cannot be invested into directly.
Past performance does not guarantee future results.