OVERVIEW
U.S. stocks ended the week lower, with the S&P 500 dropping 0.97%, the Dow falling 0.52%, and the Nasdaq bringing up the rear with a 1.87% decline.
The worst of the sell-off was centered around small-cap stocks, down 4.6%, and value stocks, which fell 1.6%. Large-cap stocks fared the best, down 0.65%, while growth stocks fell about 1.4%.
Foreign stocks were mixed, as emerging markets rose 1.66%, and developed countries fell 0.46%.
The benchmark 10-year Treasury yield fell to 1.29% from a close of 1.36% the week prior. Long-term Treasuries registered price gains of 1.01%, investment-grade bonds rose 0.31%, municipal bonds rose 0.12%, and inflation-protected Treasuries climbed 0.84%. High-yielding junk bonds, however, fell 0.15%.
Real estate was up moderately, rising about 0.24%. Commodities also had a good week, rising about 1% overall. While oil fell about 2.5%, gold and corn were up 0.38% and 5%, respectively.
The U.S. dollar strengthened about 0.65% for the week.
KEY CONSIDERATIONS
When Slower Growth is Good for Growth – Don’t look now, but growth stocks are back. Year-to-date, they are neck and neck with value stocks.
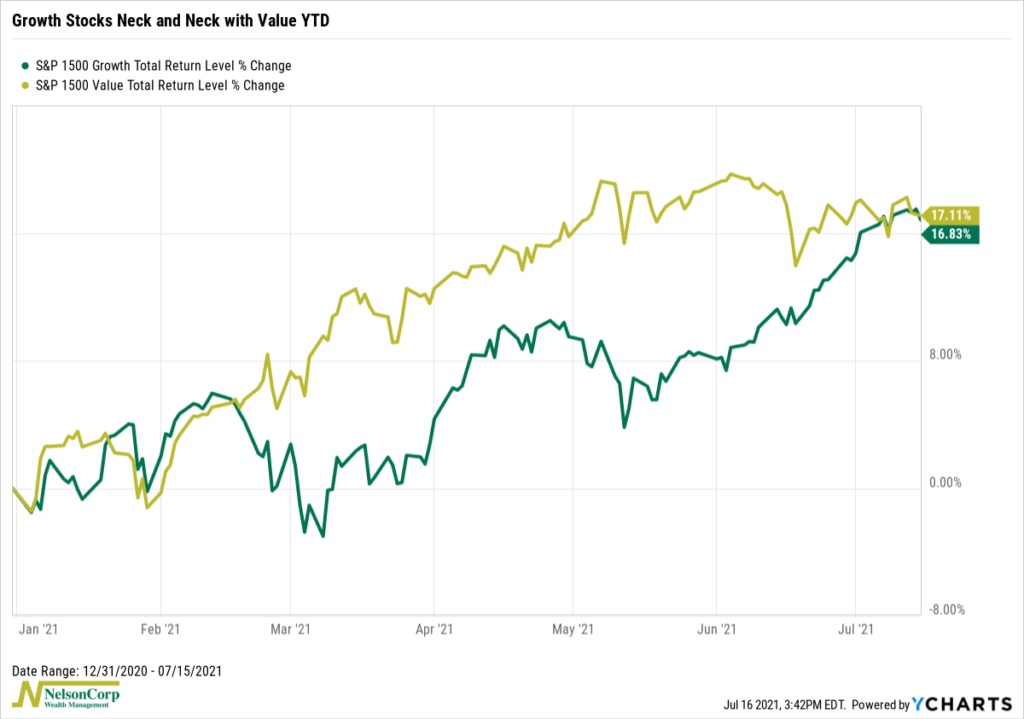
This is a shift from earlier this year. Back then, value stocks surged ahead of growth stocks as economic growth, inflation expectations, and interest rates all accelerated to the upside.
However, to some extent, these tailwinds have begun to wane in recent months, opening the door for growth stocks to play catch-up.
To understand why, look at economic growth. Sure, if you glance at the GDP numbers, economic growth is incredibly strong right now. But investors were already expecting that. And because expectations are elevated, it’s getting harder and harder for the data to beat those expectations. To illustrate, here’s the most recent reading of the Citigroup Economic Surprise Index.
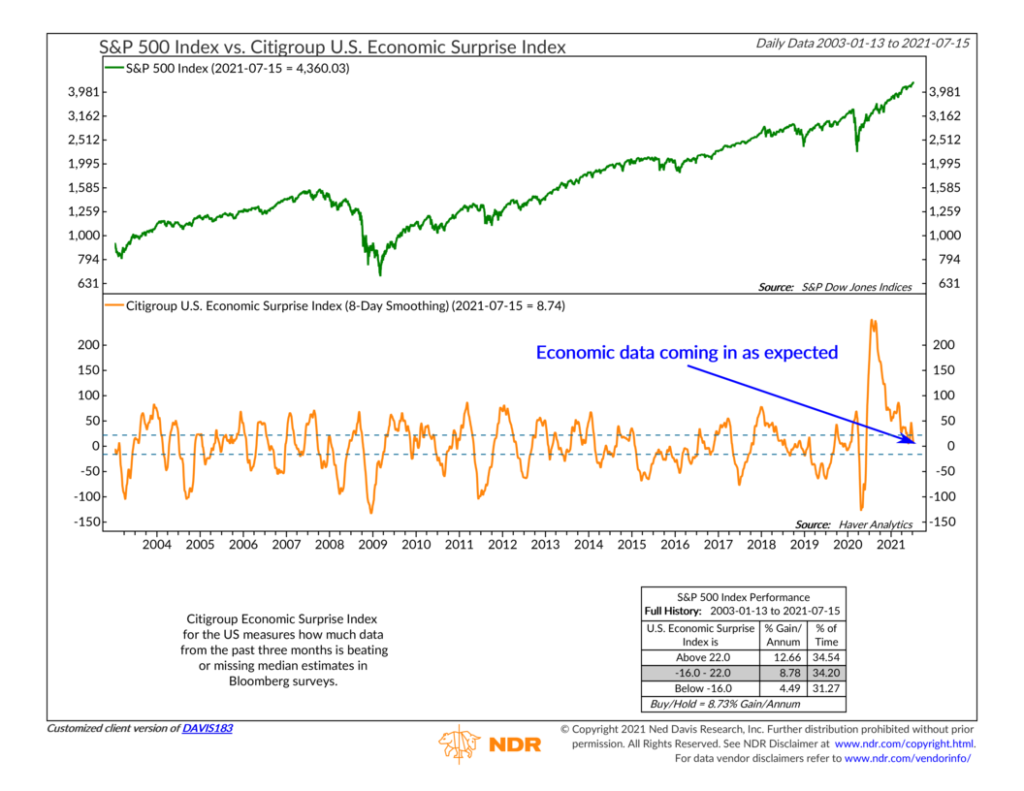
It’s saying that over the past three months, newly released economic data are struggling to beat the median analyst’s estimates by any significant amount. In fact, the measure is essentially zero now, meaning the data have neither beat nor missed expectations. Some would say we’ve reached “peak growth.”
And the bond market has taken notice. The benchmark 10-year Treasury yield is down significantly from its high this year, and the yield curve has flattened out in recent months. This has carried over into inflation expectations retreating from their April high, shown in the chart below.
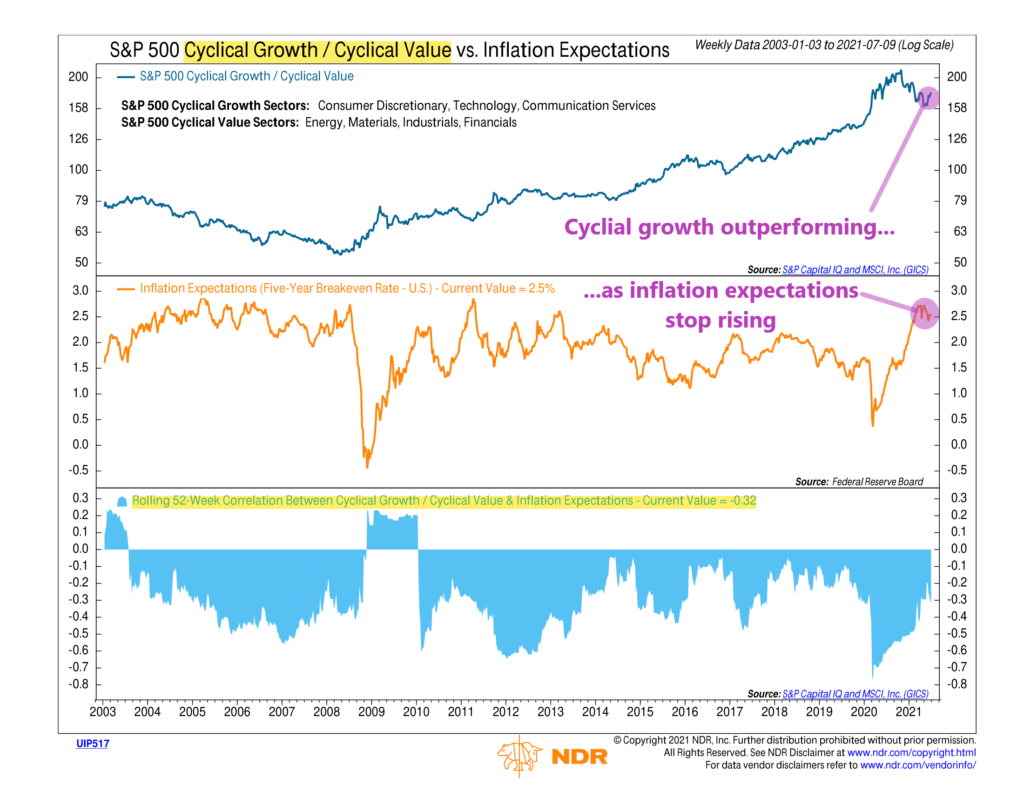
Here we show the relative performance of cyclical growth/cyclical value stocks versus inflation expectations. Historically, as the bottom clip of the chart reveals, the correlation between the two has been negative.
This means that when inflation expectations (orange line in the middle clip) are falling, the cyclical growth/cyclical value relative strength line (blue line in the top clip) rises. In other words, cyclical growth outperforms cyclical value when inflation is expected to weaken.
Sure enough, as the 5-year inflation breakeven rate has begun to roll over recently, cyclical growth stocks have resumed their outperformance versus cyclical value stocks.
This is because cyclical growth sectors—like consumer discretionary, technology, and communication services—tend to do well in slower growth environments, where inflation expectations and interest rates are relatively low.
So, the bottom line is: The slow-growth-equals-good-for-growth-stocks dynamic has been the story of the past 10+ years—and, according to this indicator, that story hasn’t ended.
This is intended for informational purposes only and should not be used as the primary basis for an investment decision. Consult an advisor for your personal situation.
Indices mentioned are unmanaged, do not incur fees, and cannot be invested into directly.
Past performance does not guarantee future results.