OVERVIEW
Markets reversed course last week, with stocks sliding broadly across the board. The S&P 500 fell 2.61%, the Dow and Nasdaq each lost 2.47%, and the Russell 3000 Growth index dropped 2.70%. Small-caps were hit hardest—the S&P 600 tumbled 4.18%—while mid-caps and value stocks also struggled.
International markets held up better. Developed markets (EAFE) rose 1.16%, and emerging markets dipped just 0.12%. A 1.83% drop in the U.S. dollar helped boost overseas returns for dollar-based investors.
Bond performance was mixed. Long-term Treasuries sank 2.04%, while intermediate- and short-term bonds declined 0.31% and gained 0.09%, respectively. High-yield bonds slipped 0.47%, and investment-grade corporates lost 0.52%.
Commodities rebounded. Gold surged 5.60%, corn rose 3.61%, and the broad commodity index gained 1.73%. Oil was flat, and real estate fell 3.55%. Meanwhile, volatility spiked—the VIX jumped over 29%—as investors braced for more short-term market turbulence.
KEY CONSIDERATIONS
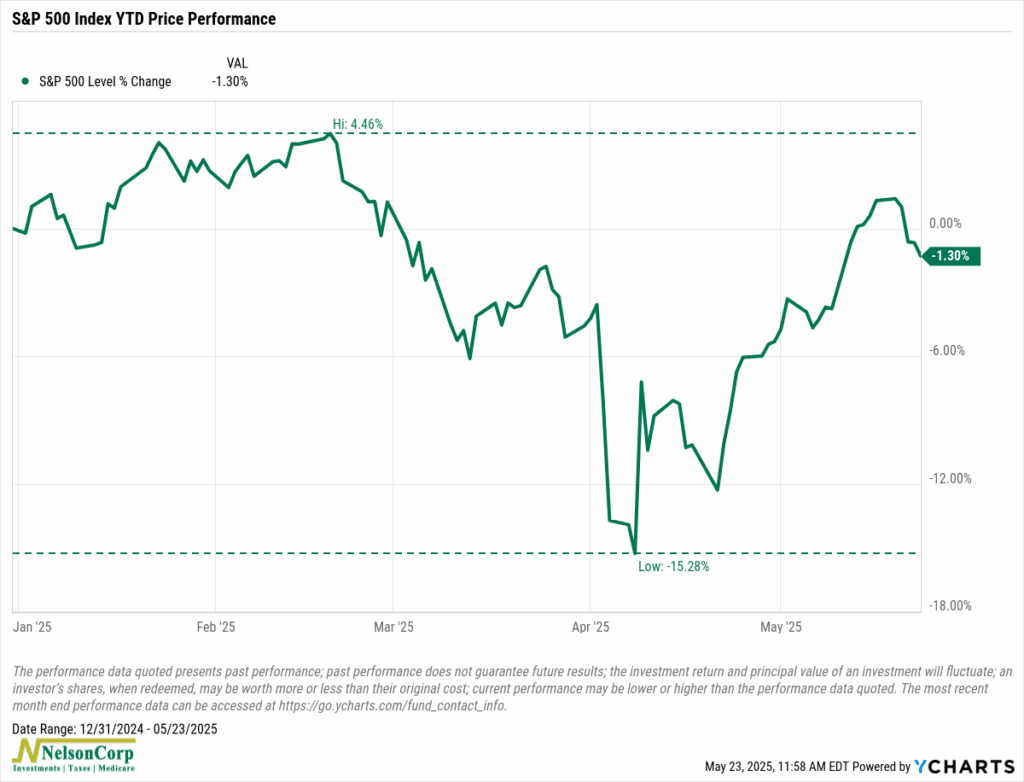
Momentum Swing – It’s been a wild ride for U.S. stocks this year. The S&P 500 Index, shown below, climbed over 4% in February, dropped more than 15% by April, and then bounced back to roughly break-even last week.
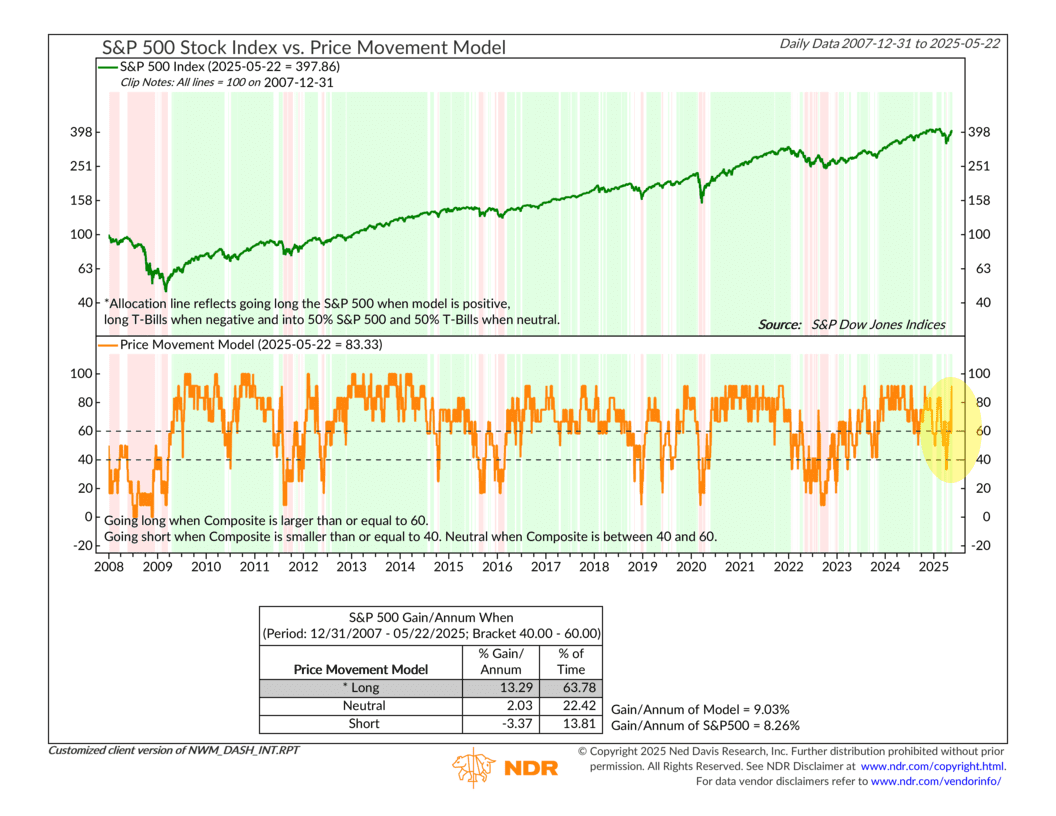
That’s a major momentum shift over just a few weeks. And we’ve even started to see it show up in our price-based indicators. As the next chart highlights, our composite of Price Movement indicators jumped from a 30% reading in April to over 90%. That’s the kind of surge that can flip a model into bullish territory.
One of the indicators driving that shift is shown below. It tracks the 5-day percentage change in global stock prices, smoothed over a 2-month period. This is a good example of a persistent momentum measure—it takes a strong and sustained price move to swing it into bullish territory after a downturn.
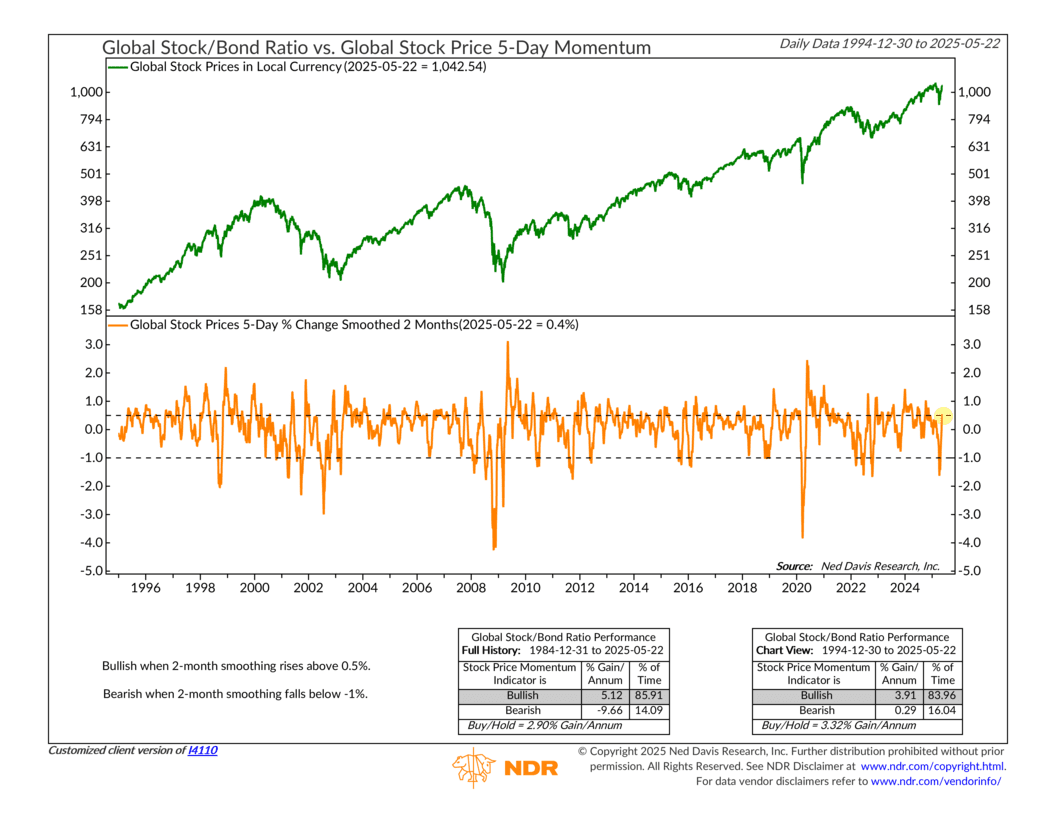
We got that last week. The market’s surge was enough to turn this longer-term momentum gauge positive again. Historically, that’s a constructive place for stocks to be.
So, does that mean the coast is clear for risk assets? According to our models, yes, actually, at least for now. But I’d add a word of caution: big swings like this can sometimes lead to short-term pullbacks or reversals.
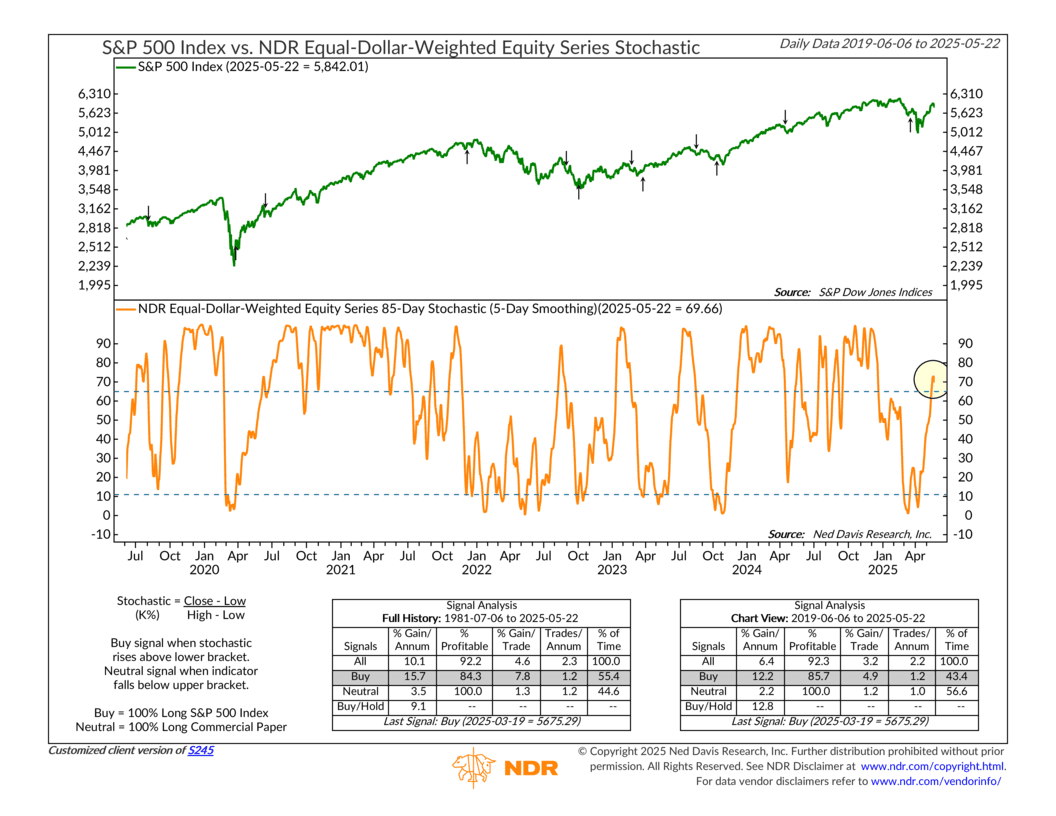
Take our 85-day stochastic indicator, for instance. It’s now in its upper zone following the recent rally. If it slips back below that upper boundary, it would trigger a sell signal. That doesn’t necessarily mean the entire model will shift, but it could signal some short-term weakness ahead. We may have already seen the start of that last week.
But the bottom line is that the market’s recent price action has definitely moved into more cooperative territory. If that holds, it should support the health of our primary stock market risk model going forward.
This is intended for informational purposes only and should not be used as the primary basis for an investment decision. Consult an advisor for your personal situation.
Indices mentioned are unmanaged, do not incur fees, and cannot be invested into directly.
Past performance does not guarantee future results.
The S&P 500 Index, or Standard & Poor’s 500 Index, is a market-capitalization-weighted index of 500 leading publicly traded companies in the U.S.