Mo Problems
OVERVIEW Markets continued to drift lower last week, with broad weakness across most major equity benchmarks. The S&P 500 declined 2.12%, the Dow Jones Industrials fell 0.90%, and the NASDAQ led to the downside with a 3.23% drop. Large-cap stocks were under...
The Oil Omen
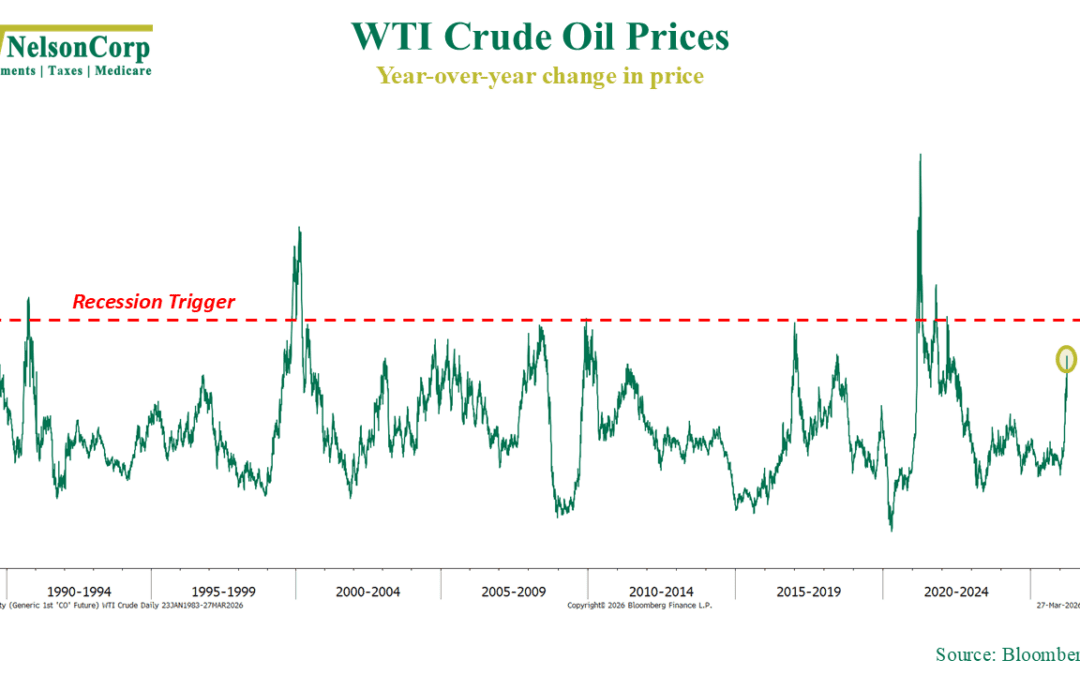
This week, I want to revisit a chart that we featured on the blog around this time last year. It shows the year-over-year change in WTI crude oil prices going back decades. In simple terms, it measures how much oil prices have risen over the past 12 months....
Feeling the Heat
There’s a reason oil prices dominate the headlines every time a geopolitical crisis breaks out. Oil touches almost everything. It fuels the trucks that move our goods, the factories that make them, and the planes that carry the people running the businesses....
Financial Focus – March 25th, 2026
Medicare supplement premiums are rising across the board, and this week Nate Kreinbrink and Mike Steigerwald break down the key reasons why, from record numbers of people aging into Medicare to expanded coverage requirements and the ongoing effects of inflation. If you’ve received a premium change notice and want to make sense of it, check out this week’s Financial Focus.
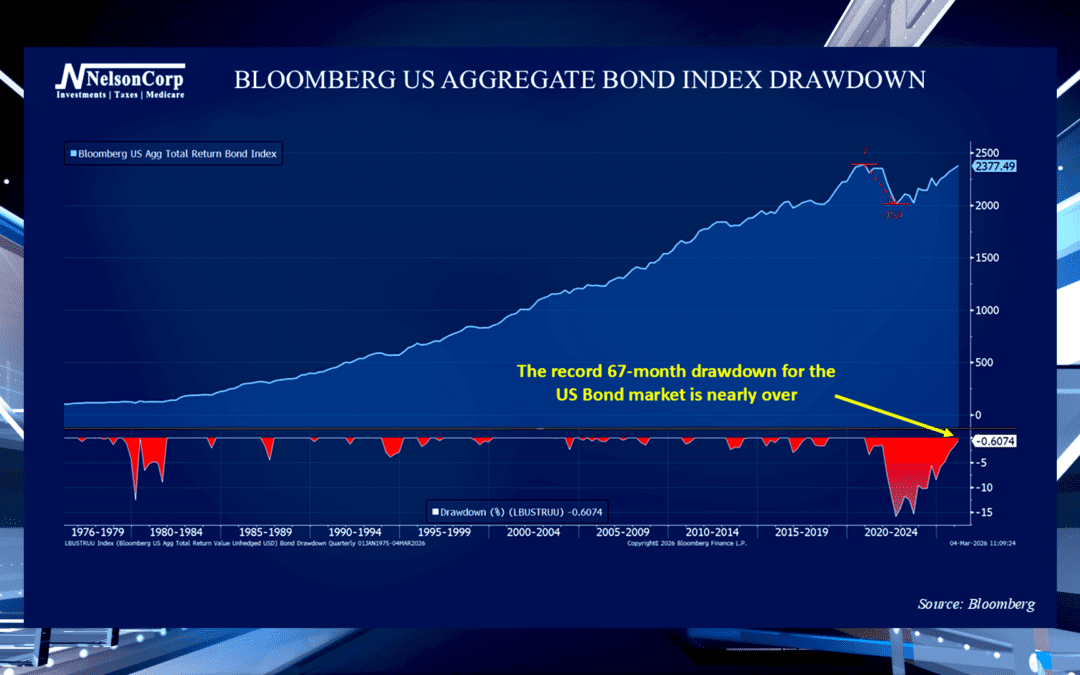
The Long Road Back
Bonds have had a challenging decade thus far. Nate Kreinbrink explains the current drawdown and shares his perspective on the future of the bond market.
Free Fallin’
OVERVIEW Markets took another step lower last week, with selling pressure showing up across most major equity benchmarks. The S&P 500 declined 1.90%, the Dow Jones Industrials fell 2.11%, and the NASDAQ dropped 2.07%. Large-cap stocks were hit as well, with...
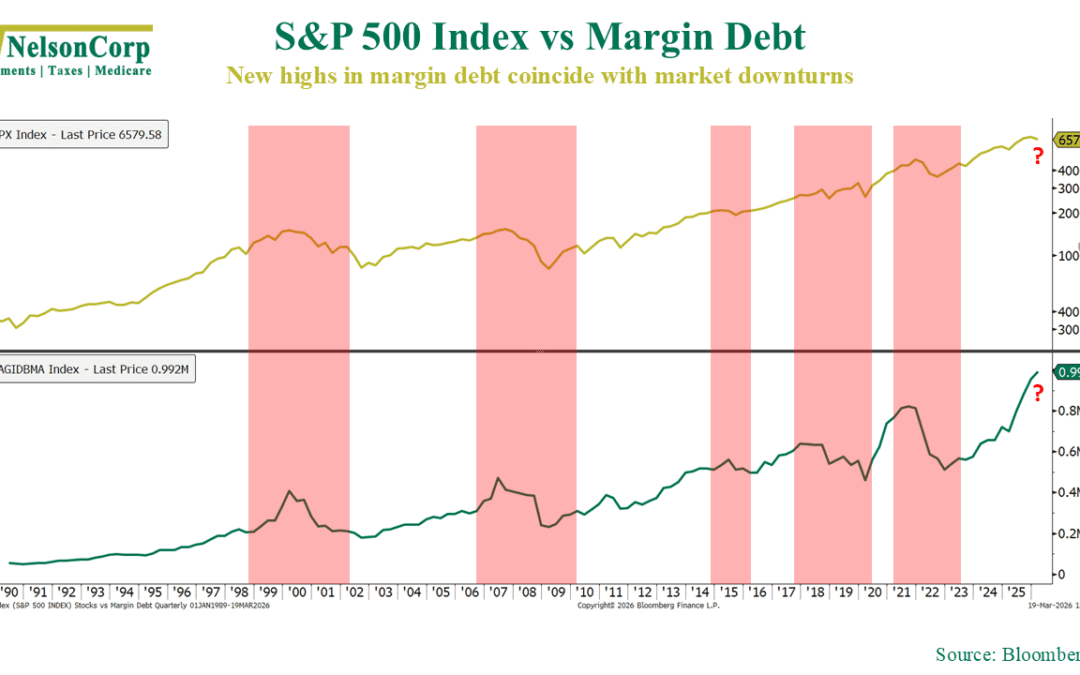
Too Much Debt
Too much debt can create problems. That’s true for individuals, corporations, and—it turns out—even the stock market. This week’s chart illustrates why. The chart above compares the S&P 500 stock index (gold line, top) to margin debt levels (green line,...
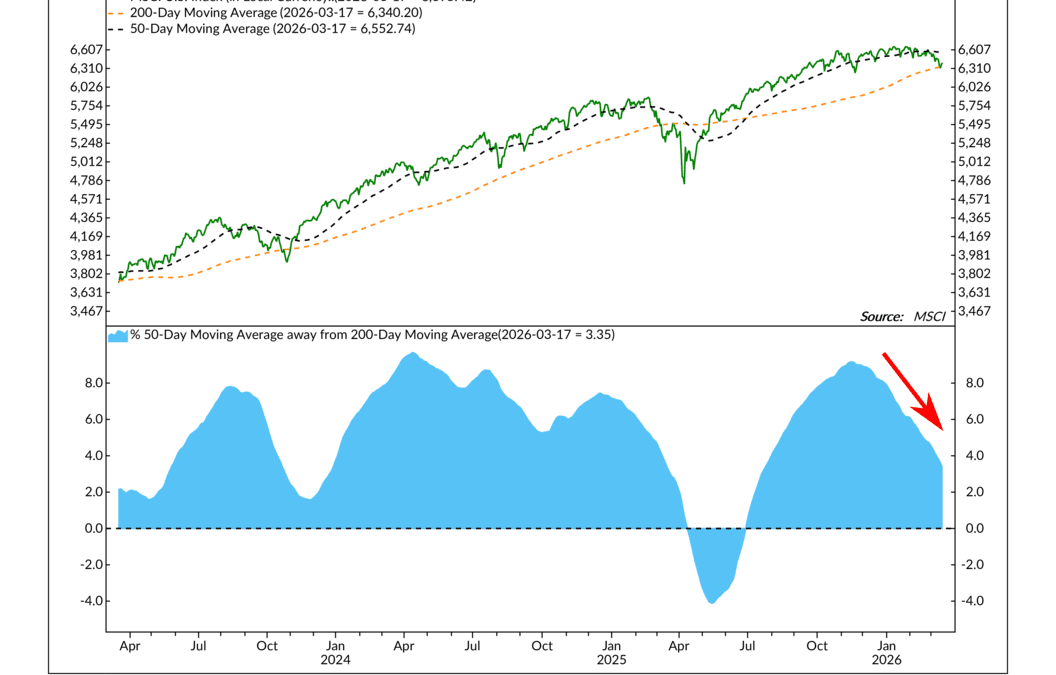
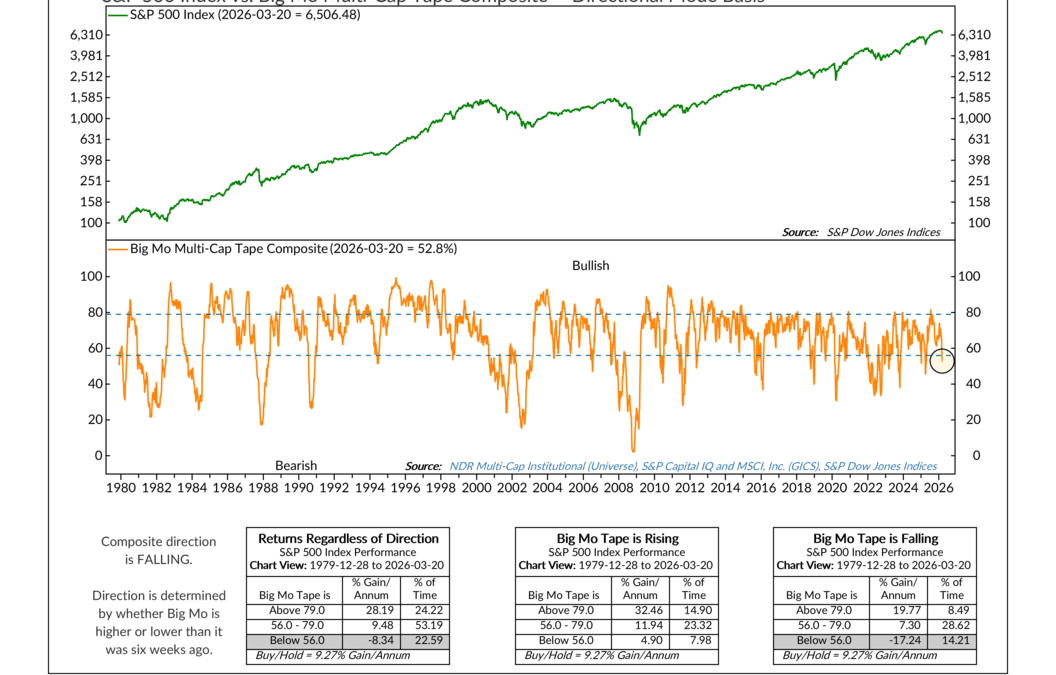
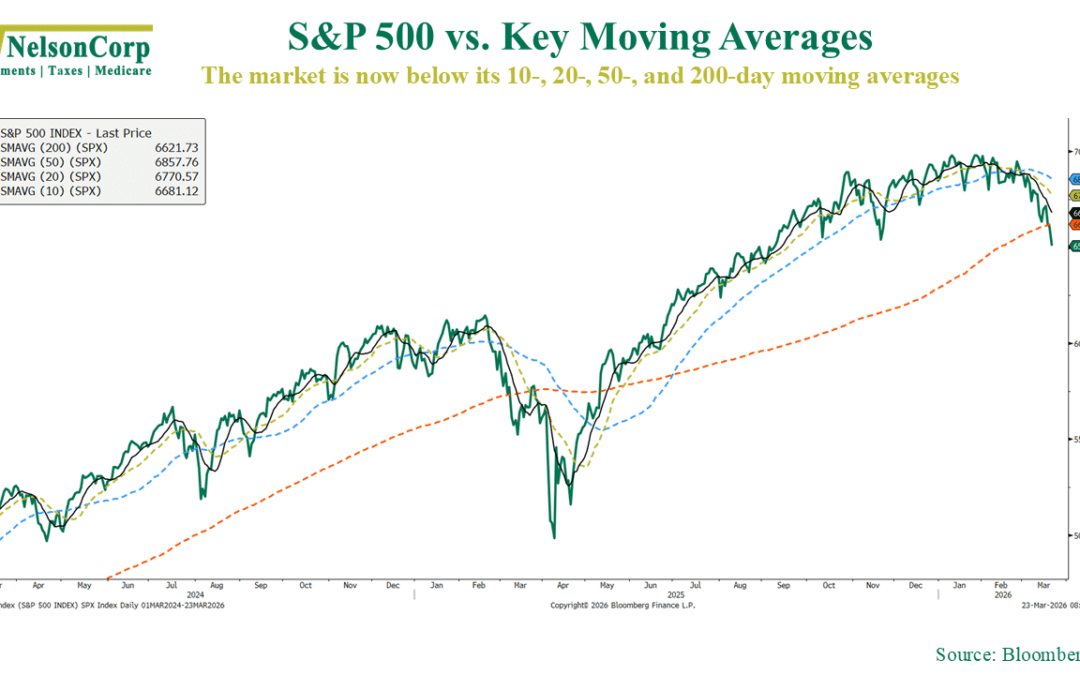
Measuring the Tide
You can kind of think of the stock market as existing in one of two states, either above water or below water. By that, I’m referring to the market’s trend. Is it generally moving higher, or drifting lower? To put some structure around that idea, we can look at...
Financial Focus – March 18th, 2026
Mike Steigerwald sits down with tax specialist Andy Fergurson to break down what they’re seeing this tax season and the key things filers need to watch for before submitting their returns. From new deductions and missing documents to common mistakes that can delay refunds, they share practical tips to help you avoid headaches and get it right the first time.
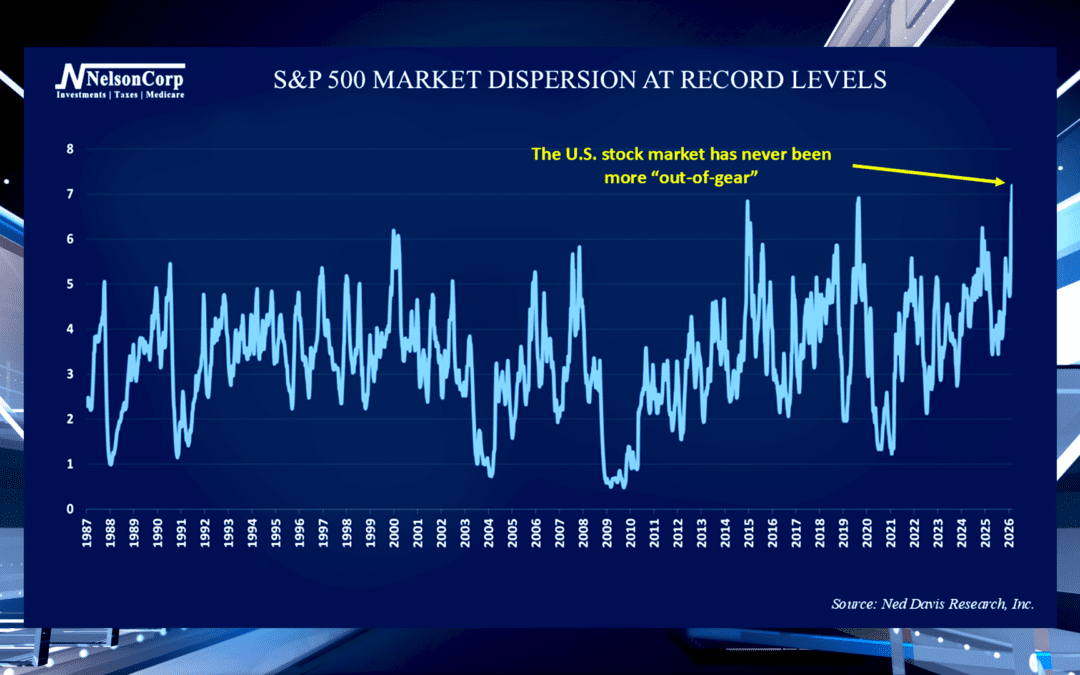
Out of Gear
Investors often focus on the major indexes like the S&P 500. David Nelson is here to explain what investors can learn by looking at individual stocks beneath the market surface especially with the upcoming Federal Reserve leadership change.

880 13th Avenue North
Clinton, Iowa 52732
563-242-9042
5465 Utica Ridge Road
Davenport, Iowa 52807
563-823-0532
9079 East Tamarack Drive
Dubuque, Iowa 52003
800-248-9042
info@nelsoncorp.com
Fax: 563-242-9062
Securities offered through Registered Representatives of Cambridge Investment Research, Inc., a broker-dealer, member FINRA/SIPC. Advisory services through Cambridge Investment Research Advisors, Inc., a Registered Investment Advisor. Cambridge and NelsonCorp Wealth Management are not affiliated. This communication is strictly intended for individuals residing in the states of AZ, AR, CA, CO, CT, FL, GA, IA, IL, IN, ME, MI, MN, MO, NC, NJ, NY, SD, TN, TX, UT, WI, and WY. No offers may be made or accepted from any resident outside the specific states referenced. Investing involves risk. Depending on the different types of investments there may be varying degrees of risk. Clients and prospective clients should be prepared to bear investment loss including loss of original principal.
Cambridge’s Form CRS (Customer Relationship Summary)
The information being provided is strictly as a courtesy. When you link to any of these websites provided herein, NelsonCorp Wealth Management makes no representation as to the completeness or accuracy of information provided at these sites. Nor is the company liable for any direct or indirect technical or system issues or any consequences arising out of your access to or your use of third-party technologies, sites, information, and programs made available through this site.