OVERVIEW
Markets lost a bit of steam last week, with most major indexes slipping slightly after a strong rebound in late April.
The S&P 500 fell 0.47%, the Dow edged down 0.16%, and the Nasdaq slipped 0.27%. Growth stocks underperformed—Russell 3000 Growth dropped 0.57%—while value names held flat. Small- and mid-cap stocks bucked the trend, with the S&P 600 and S&P 400 rising 0.52% and 0.49%, respectively.
International stocks were mixed. Developed markets (EAFE) dipped 0.24%, but emerging markets gained 0.45%, helped by strength in oil and commodity prices. The U.S. dollar rose 0.47%, slightly weighing on foreign returns for dollar-based investors.
Bond markets offered a mixed picture. Long-term Treasuries dropped 0.77%, while intermediate-term bonds fell 0.28%. High-yield bonds managed a 0.15% gain, and short-term Treasuries added 0.07%. Investment-grade corporates slid 0.10%.
Commodities rallied. Oil surged 4.06%, gold jumped 3.63%, and the broad commodity index rose 1.29%. Corn was the lone laggard, down 4.10%. Real estate declined 0.61%, and MLPs sank 1.53%. The VIX fell sharply, down 3.44%, signaling calmer markets despite the weekly pullback.
KEY CONSIDERATIONS
Say Something Nice – Whenever my kids get into a fight and one of them says something mean, my wife and I like to step in with a simple rule: “OK, now say three nice things about the other person.”
Today, I’m going to do the same thing—but with the stock market.
Let’s be honest: over the past few months, there haven’t been many nice things to say. It’s been a rough stretch for investors. But there are a few bright spots worth pointing out.
First, let’s talk about the tape—a fancy word for the market’s price action.
The chart below uses breadth, specifically the percentage of NYSE stocks trading above their 200-day moving averages, to gauge whether the market has reached a bottom. The key level here is 20%. When fewer than 20% of stocks are in defined uptrends, it signals that selling may have run its course.
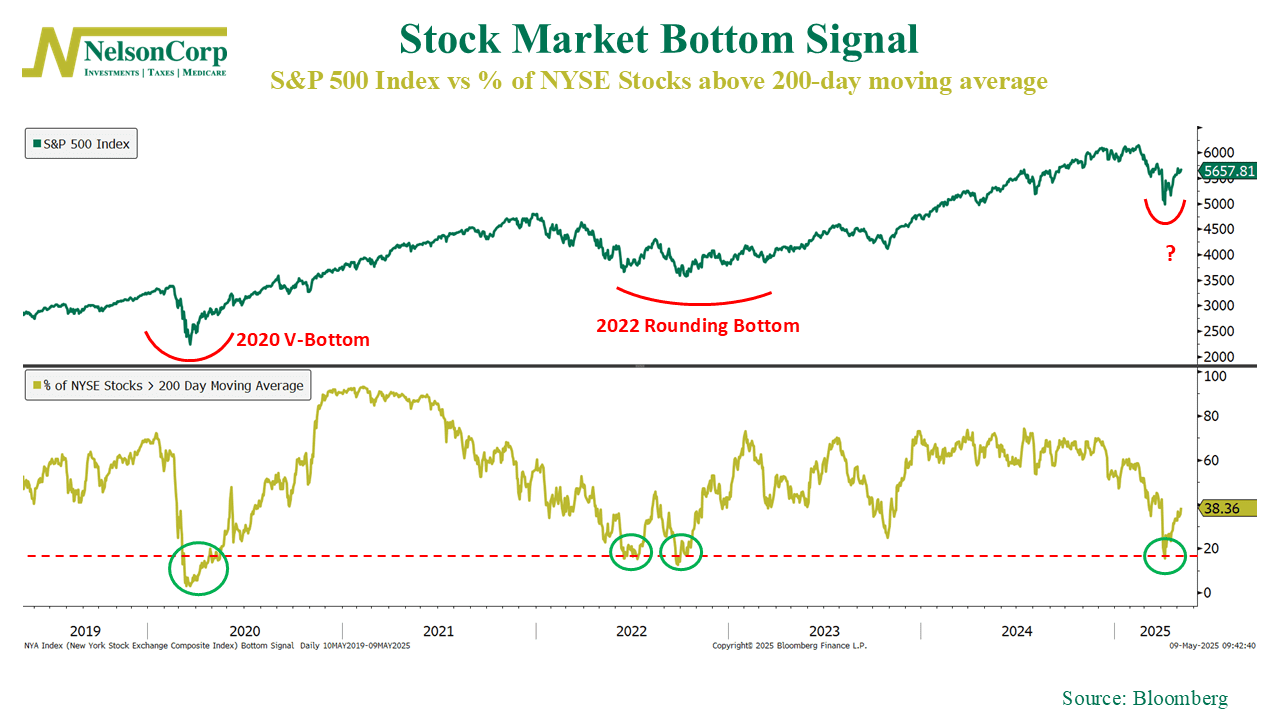
Why does that matter? Because this kind of reading is what we call a “washout.” Historically, when breadth falls this low, it often means the worst is over. Sellers are exhausted, and the market is ready to turn higher.
We’ve already seen that 20% threshold get hit, and since then stocks have started climbing. So, according to this indicator, the bottom is likely in.
But that’s just one indicator. Sometimes the tape can be fickle. So, we like to look at external factors as well—things outside the market’s price action.
Sentiment is one of them. And as the next chart shows, investor sentiment also reached “washed out” levels a few weeks ago.
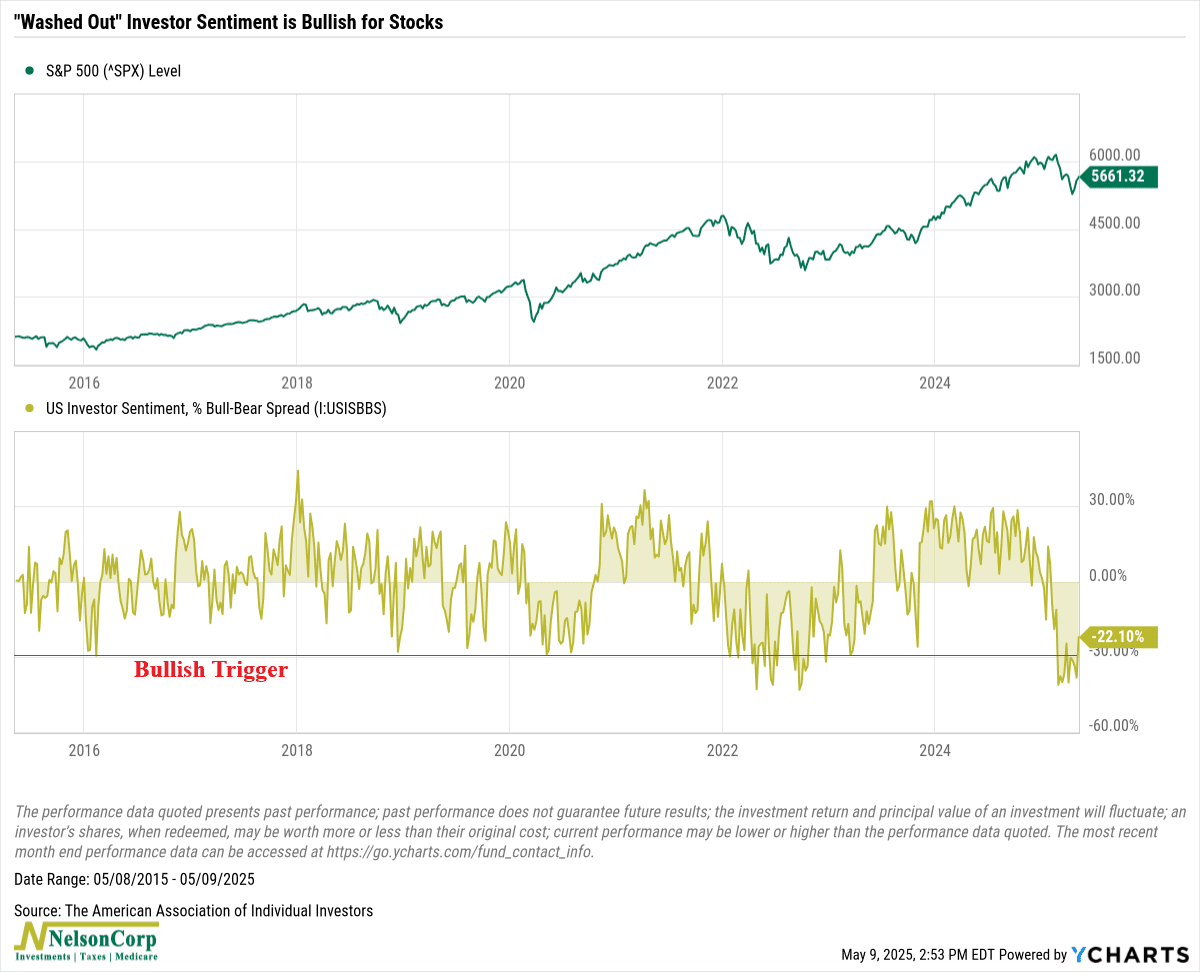
The AAII Sentiment Survey, which measures the gap between bullish and bearish investors, dropped to deeply negative territory just as the market was bottoming. It’s still firmly negative, meaning more investors expect things to get worse than better.
But from a contrarian perspective, that’s actually a positive. When investor emotions hit extremes—especially when the technical and fundamental backdrop is improving—it often signals a turning point.
So that’s two nice things I have to say about the stock market. The price action is improving, thanks to washed out breadth, and sentiment looks favorable from a contrarian standpoint.
But what about the third and final nice thing?
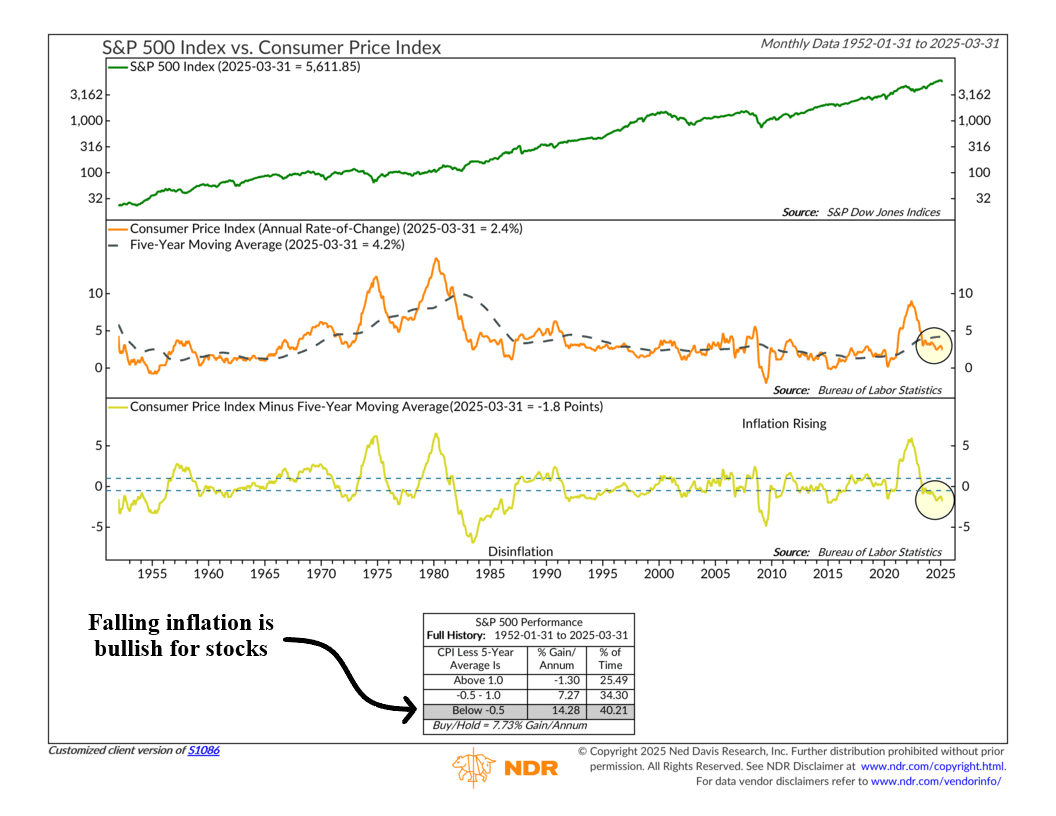
Well, for that, I’ll turn to the economy. What’s been the biggest worry for most people? That’s right: Inflation. It’s been a persistent problem over the past few years.
But according to our final indicator, inflation continues to fall on an annualized basis relative to its 5-year average. It now sits in a zone that historically aligns with higher stock prices.
Believe it or not, when we look at the six major categories in our economic model, inflation is the only one flashing positive. Everything else is either neutral or negative.
So yes, there are plenty of reasons to be frustrated with the market. Many of them are valid.
But the bottom line is that sometimes, it’s worth stepping back and saying a few nice things.
And right now, a few of those things are starting to trend in the right direction.
This is intended for informational purposes only and should not be used as the primary basis for an investment decision. Consult an advisor for your personal situation.
Indices mentioned are unmanaged, do not incur fees, and cannot be invested into directly.
Past performance does not guarantee future results.
The S&P 500 Index, or Standard & Poor’s 500 Index, is a market-capitalization-weighted index of 500 leading publicly traded companies in the U.S.