OVERVIEW
Markets extended their rebound last week, building on the momentum that started in late April.
The S&P 500 rose 2.92%, the Dow gained 3.00%, and the Nasdaq climbed 3.42%. Most major indexes remain negative year-to-date, but recent gains have helped ease the sting. Growth stocks continued to lead—Russell 3000 Growth added 3.39%—while value rose 2.55%. Mid-caps posted the strongest move among size categories, with the S&P 400 up 3.54%, and small-caps followed close behind at 3.18%.
International stocks joined the rally. Developed markets (EAFE) rose 3.09%, and emerging markets added 3.30%. A slight rise in the U.S. dollar (+0.51%) modestly offset those gains for U.S.-based investors.
Bond returns were mixed. Long-term Treasuries fell 0.93%, while intermediate-term bonds slipped 0.24%. TIPS declined 0.71%, and investment-grade corporates dropped 0.43%. High-yield bonds managed a 0.27% gain.
Commodities had a tougher time. Oil sank 7.27%, gold dropped 1.67%, and corn slid 3.40%. Real estate posted a strong 3.10% gain, while MLPs lost ground, down 2.86%. The VIX tumbled another 8.70%, reflecting cooling volatility as markets steadied.
KEY CONSIDERATIONS
Sell in May? – “Sell in May and go away.” It’s one of those old Wall Street sayings that’s easy to remember, often repeated, and historically not without some merit.
But if you’ve followed that advice recently, it’s probably cost you. As the chart below shows, the S&P 500 has delivered positive returns in nine of the past ten Mays, with an average gain of nearly 1%.
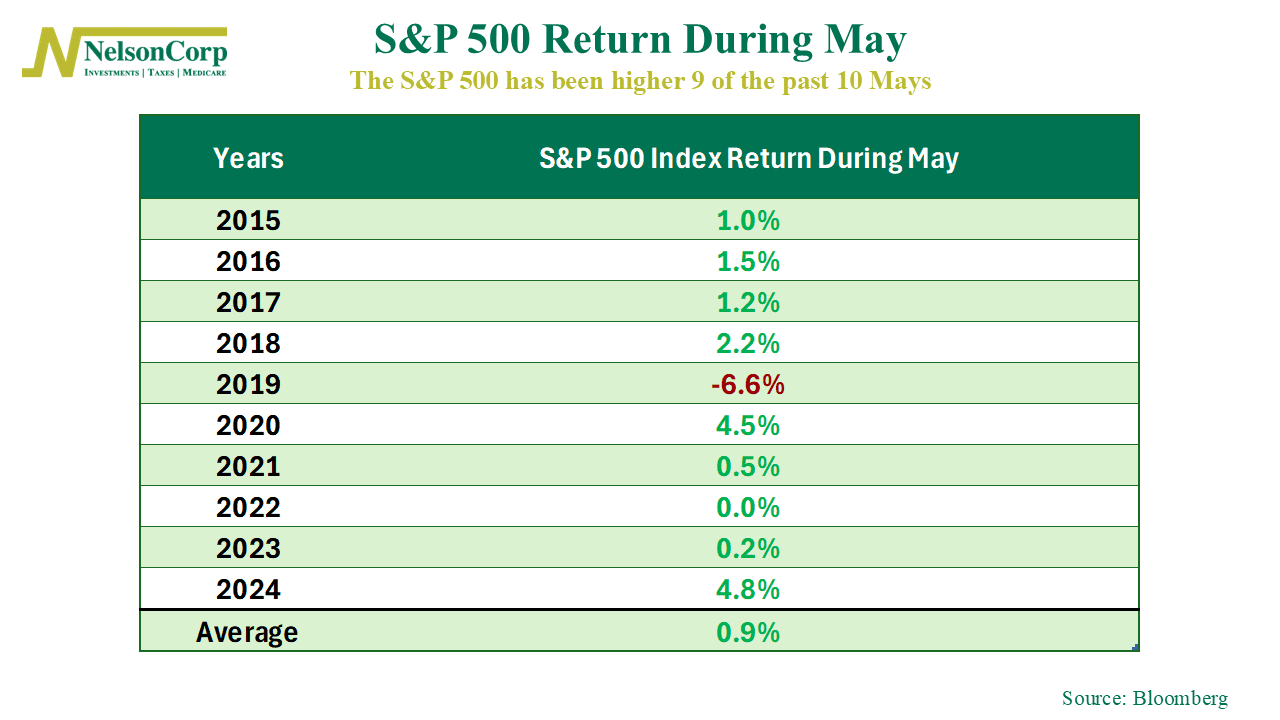
Seasonality can be fun to watch—and sometimes it works. But we prefer a weight-of-the-evidence approach. And right now, the evidence is leaning more toward: “Don’t sell in May.”
Why? Let’s start with the trend.
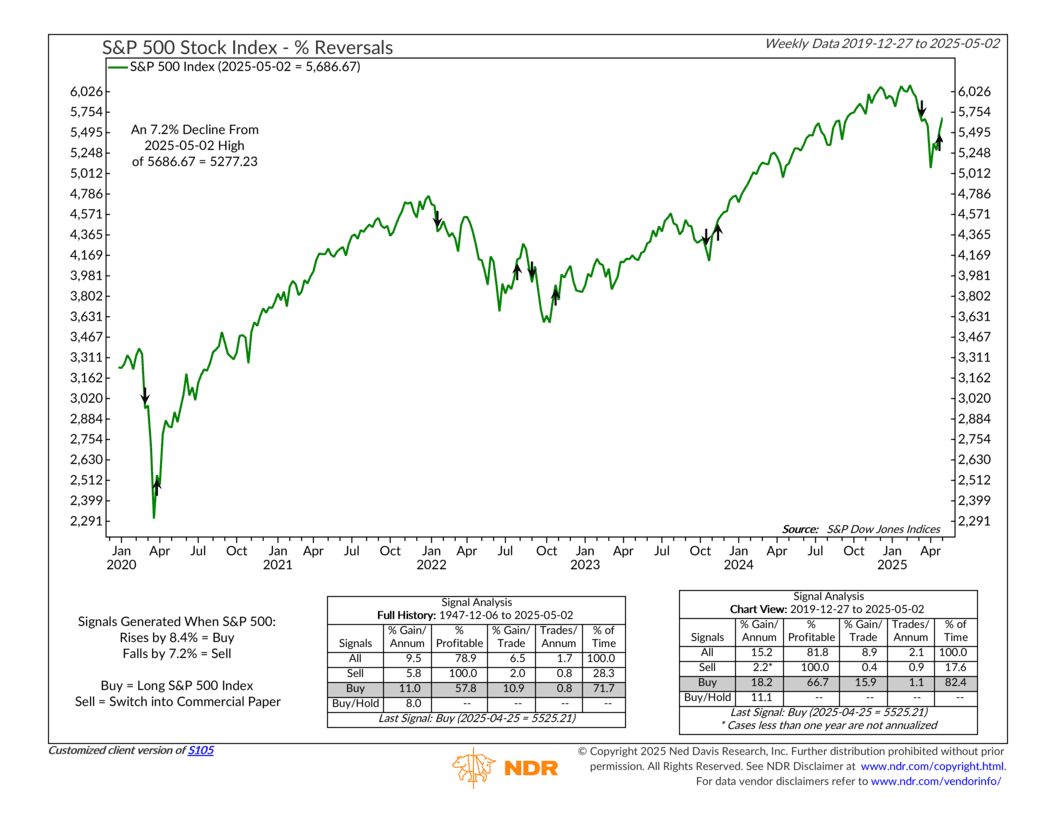
One of the simplest tools in our playbook—a trend reversal signal—just turned positive. As the next chart shows, the S&P 500 has now risen more than 8.4% from its recent low, triggering a fresh “buy” signal. It’s not flashy, but it works. Historically, these signals have delivered solid returns, especially when they’re backed by broader confirmation.
Which brings us to participation.
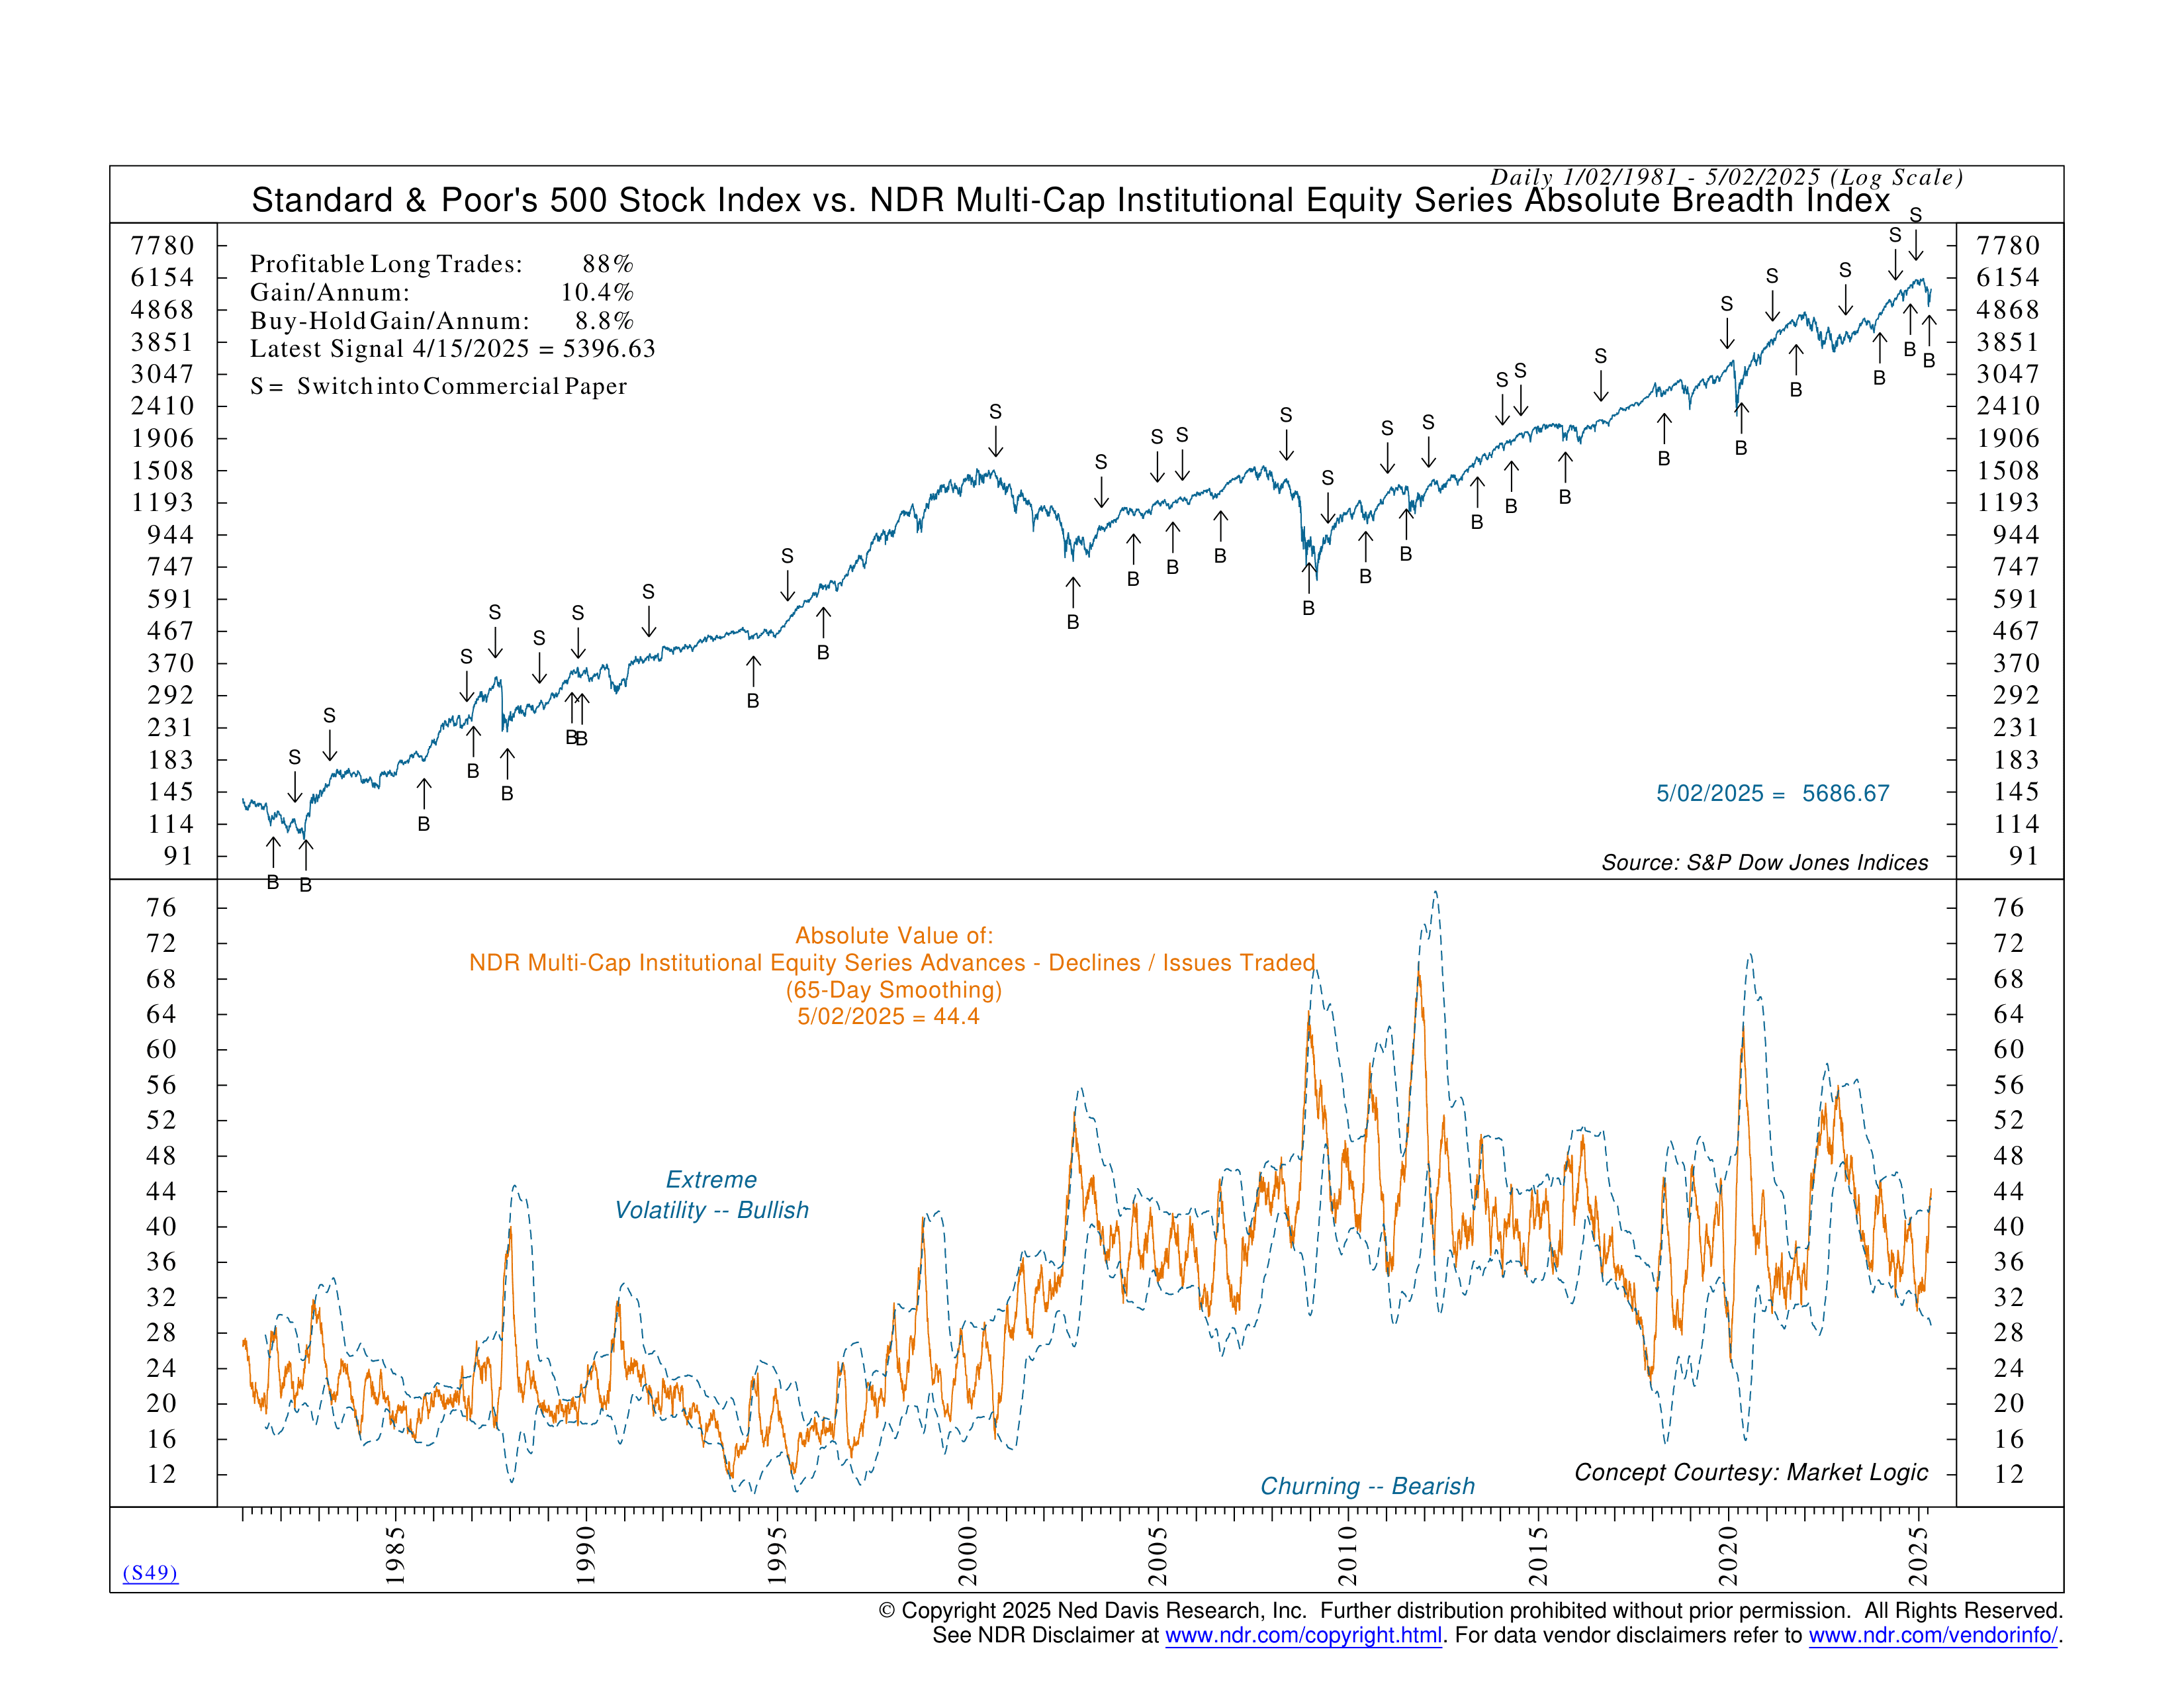
Our Absolute Breadth indicator (shown below) recently flipped bullish. That tells us more and more stocks are moving up together—a healthy sign that the rally is widening out and gaining strength.
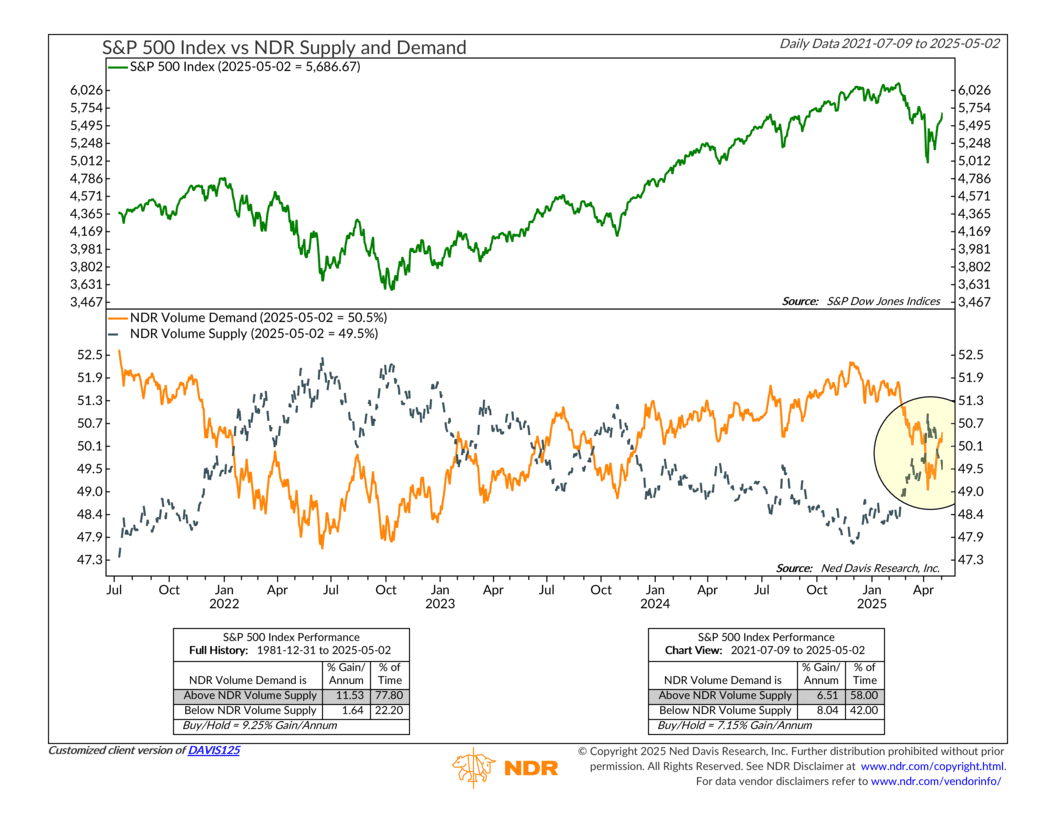
We usually see this kind of broad participation when demand starts flowing back into the market—and that’s exactly what the next chart shows. It tracks volume supply and demand. When volume in rising stocks (demand) outpaces volume in falling stocks (supply), the market has historically returned over 11% annualized. We’re back in that territory now.
And finally, there’s sentiment. Or more specifically, positioning.
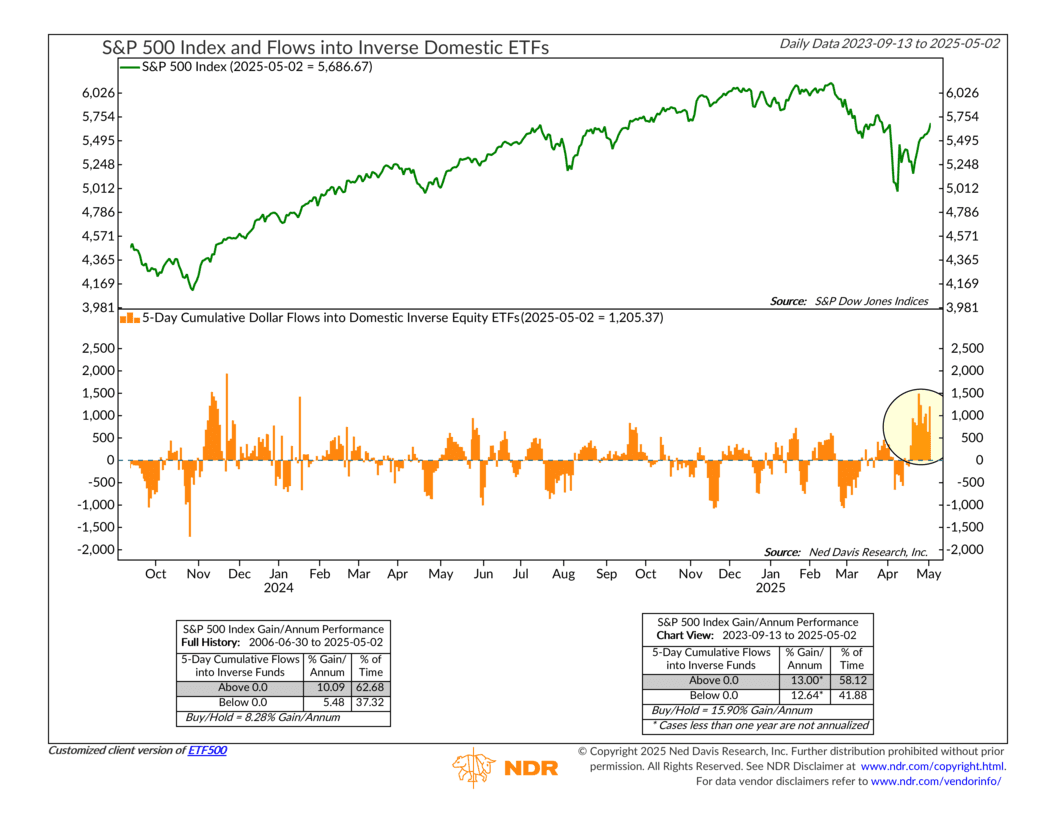
What are investors doing with their money? As the last chart highlights, we’ve seen a surge of inflows into inverse ETFs—products designed to profit when the market falls. That kind of heavy bearish positioning can often backfire. It’s a classic contrarian signal: when everyone’s expecting more pain, the market tends to surprise in the other direction.
So, the bottom line is this: while seasonal sayings make for good headlines, what really matters is what the data is saying today. And today, it’s saying things are improving. We’ve got a fresh trend reversal, broader participation, rising demand, and a lopsided dose of investor pessimism.
That’s a setup that favors the bulls.
This is intended for informational purposes only and should not be used as the primary basis for an investment decision. Consult an advisor for your personal situation.
Indices mentioned are unmanaged, do not incur fees, and cannot be invested into directly.
Past performance does not guarantee future results.
The S&P 500 Index, or Standard & Poor’s 500 Index, is a market-capitalization-weighted index of 500 leading publicly traded companies in the U.S.