OVERVIEW
Markets came roaring back last week, fueled by a broad rally across stocks. The S&P 500 jumped 5.27%, the Dow rose 3.41%, and the Nasdaq surged 7.15%. Growth stocks led the charge—Russell 3000 Growth gained 6.97%—while value also participated with a 3.29% advance. Small- and mid-caps joined the rally, with the S&P 600 up 4.59% and the S&P 400 up 4.82%.
International markets posted modest gains. Developed markets (EAFE) rose 0.78%, and emerging markets added 2.98%. A 0.80% rise in the U.S. dollar slightly trimmed foreign returns for U.S. investors.
Bond markets were mixed. Long-term Treasuries fell 0.88%, and intermediate-term bonds declined 0.34%. Short-term Treasuries eked out a 0.06% gain, while high-yield bonds rose 0.87%. Investment-grade corporates edged up 0.19%.
Commodities were under pressure. Gold dropped 4.37%, corn fell 1.39%, and the broad commodity index slid 1.76%. Oil was the lone standout, climbing 2.24%. Real estate rose 1.28%, and MLPs gained 4.49%. The VIX plunged 21.28%, reflecting a sharp drop in market volatility as investor confidence returned.
KEY CONSIDERATIONS
Two Paths – Markets were fairly quiet last week. The broader indexes moved higher without much fanfare. But under the surface, two very significant things happened—and they’re quite bullish
What happened? Well, you can kind of think of the stock market as existing in one of two states. Either volatility is high, and prices are trending lower—that’s bad. Or volatility is low, and prices are trending higher—that’s good. Sure, there’s more to it than that, but when you boil it down, that’s really the essence of it.
Let me show you exactly what I mean—and how we quantify it.
The chart below shows two distinct performance paths for the S&P 500 over time. The green line reflects periods when volatility is low (VIX below 20) and prices are trending higher (S&P 500 above its 200-day moving average). The gold line shows the opposite—when volatility is high (VIX at or above 20) and the market is in a downtrend (S&P 500 below its 200-day).
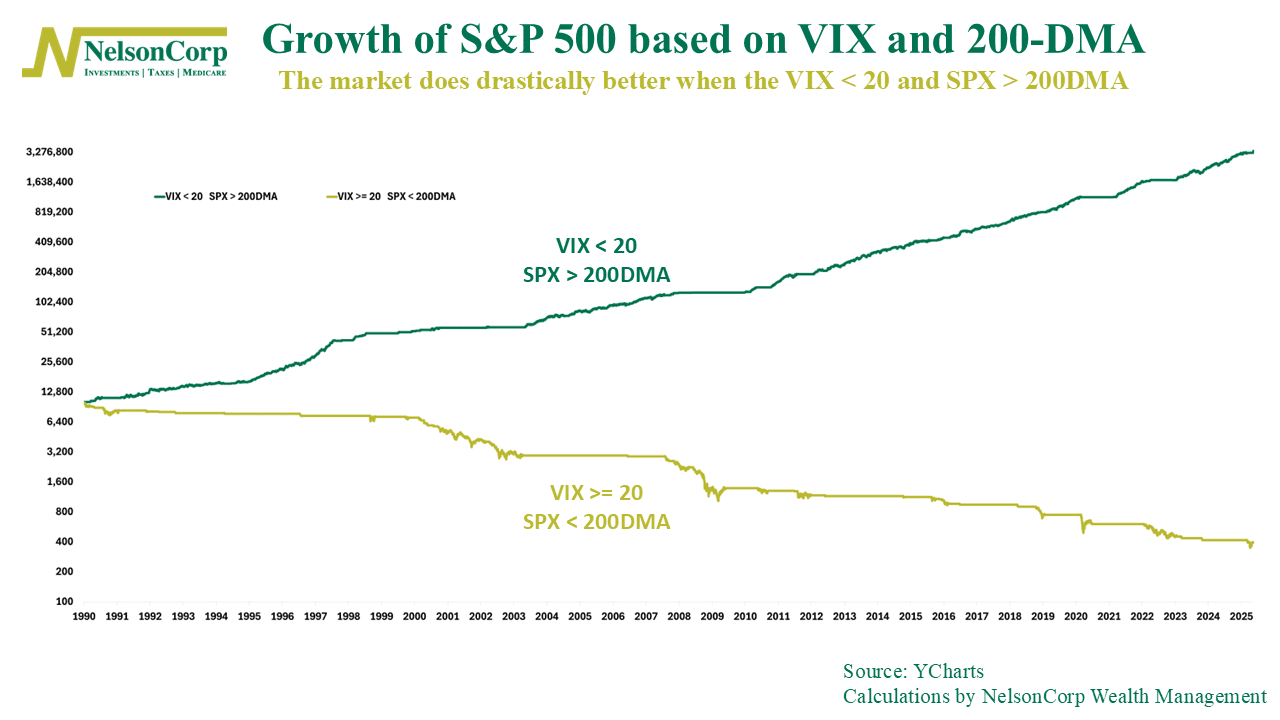
The difference between the two is pretty striking. Obviously, we’d prefer to be invested alongside the green line—when volatility is low and the trend is up.
Coming into the year, that’s exactly where the market was, and things looked good. But our primary stock market risk model sniffed out that something wasn’t right. Sure enough, volatility suddenly spiked, the trend broke down, and the market slipped onto the gold path.
But now, it looks like things might be turning around.
On Monday, we saw both the VIX fall back below 20 and the S&P 500 rise above its 200-day moving average. It happened at the same time, on the same day. That’s a pretty bullish signal. And our primary stock market risk model seems to agree.
So, the bottom line? The market just flipped back into a more favorable regime—one where volatility is falling and prices are trending higher. Historically, that’s a pretty good place for the market to be.
This is intended for informational purposes only and should not be used as the primary basis for an investment decision. Consult an advisor for your personal situation.
Indices mentioned are unmanaged, do not incur fees, and cannot be invested into directly.
Past performance does not guarantee future results.
The S&P 500 Index, or Standard & Poor’s 500 Index, is a market-capitalization-weighted index of 500 leading publicly traded companies in the U.S.