OVERVIEW
Markets bounced back sharply last week, recouping a big chunk of April’s earlier losses.
The S&P 500 rallied 4.59%, the Dow climbed 2.48%, and the Nasdaq soared 6.73%. Year-to-date losses narrowed, though the Nasdaq remains down nearly 10%. Growth stocks led the charge—Russell 3000 Growth jumped 6.68%—while value stocks posted a smaller 2.35% gain. Small- and mid-caps participated too, with the S&P 600 and S&P 400 up 3.78% and 3.18%, respectively.
International markets kept pace. Developed markets (EAFE) rose 2.68%, and emerging markets added 2.67%. The U.S. dollar edged up 0.33% for the week.
Bond markets also strengthened. Intermediate-term Treasuries gained 0.54%, long-term Treasuries rose 1.73%, and TIPS added 0.72%. Investment-grade corporates climbed 1.02%, and high-yield bonds advanced 1.29%.
Commodity performance was mixed. Oil slipped 0.65% and gold dipped 0.90%, while MLPs rallied 1.70%. The VIX plunged another 16%, signaling cooling volatility after a turbulent month.
KEY CONSIDERATIONS
Gaining Confidence – Investors have been nervous lately. You can feel it in the way people talk about the market, and you can see it in the numbers. But sometimes, a little fear is what’s needed to set up the next move higher.
After last week’s rebound, it feels like the market is starting to get some of that confidence back. One way we keep track of sentiment is with the Bull-Bear Spread, which shows how many investors are feeling positive versus negative. Recently, that number sank to -33.6%, meaning bears outnumbered bulls by a wide margin. Historically, when sentiment gets this bad and then starts to turn higher, it has often been a good sign for future gains. And lately, we’ve seen a small but important tick back up.
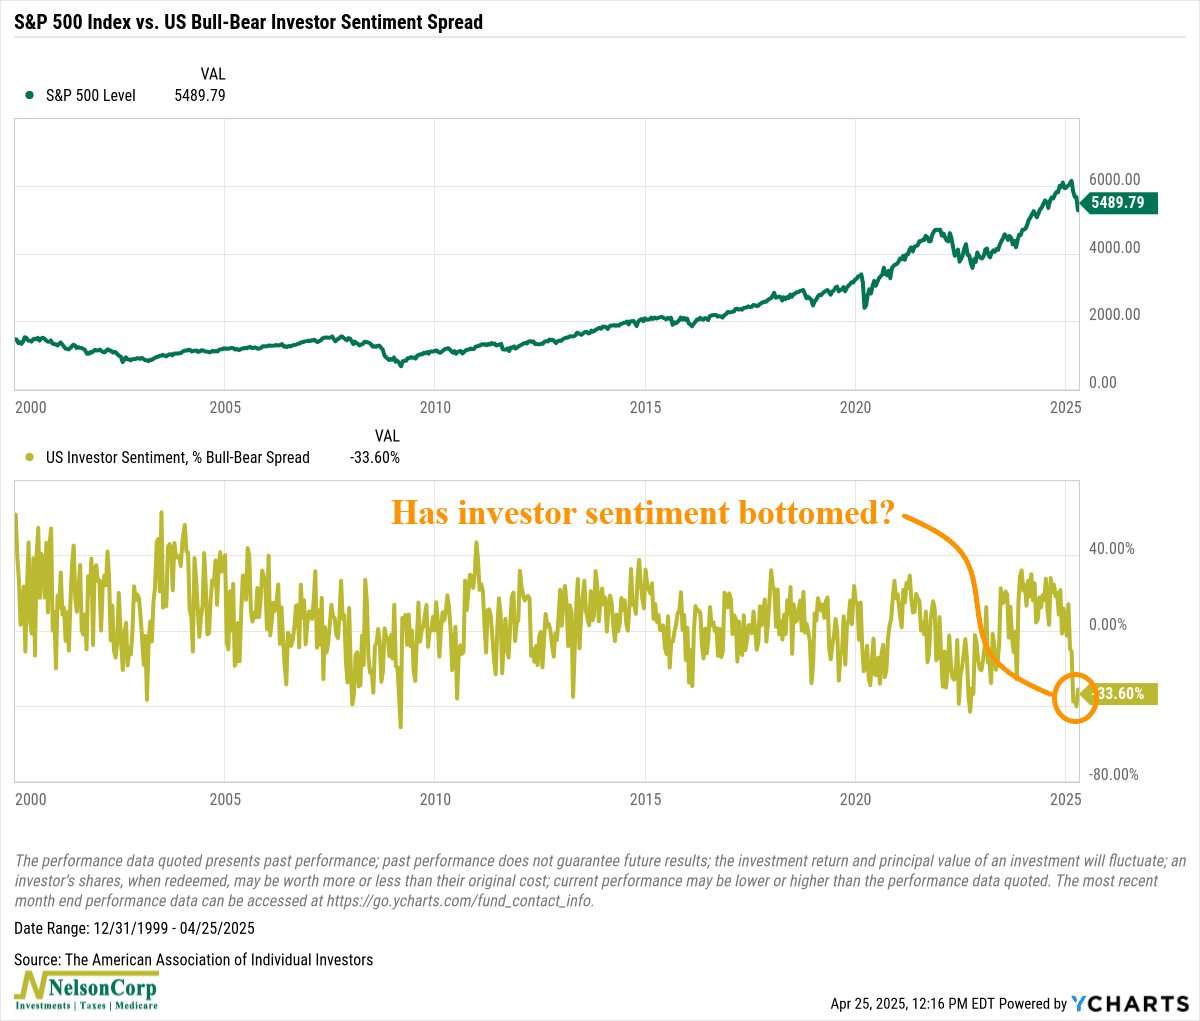
Part of the reason could be politics. A softer tone on tariffs from the administration has likely helped ease some nerves. That’s showing up in market valuations too. The forward P/E on the S&P 500 is now close to 21. It’s not cheap, but it does show that investors are willing to pay for growth again.
Still, the market has some work to do. It needs to prove it can hold onto this recovery.
One thing we are watching closely is the VIX. When volatility spikes and then pulls back, it often signals a better environment for stocks. Our VIX deviation indicator is starting to show that pattern now. If it keeps fading, that would be another sign the market is gaining its footing confidence-wise.
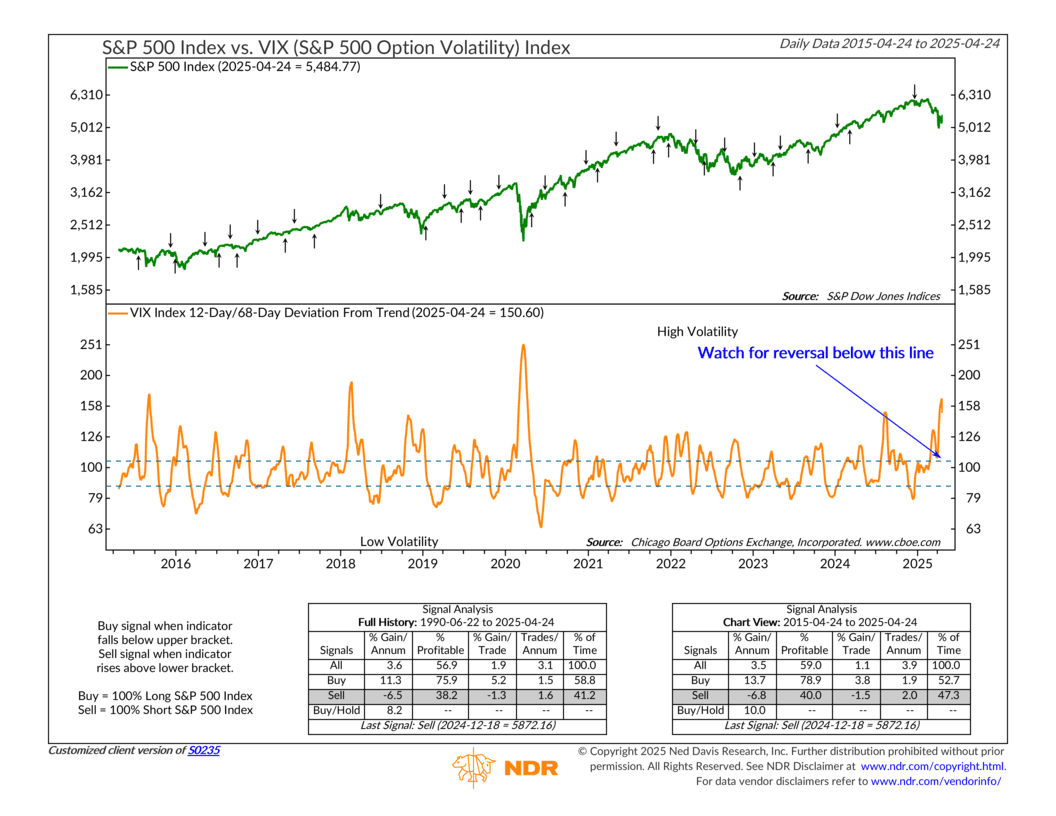
Big picture: confidence is still low, but it’s showing signs of reversing. And for long-term investors, that’s often when the best opportunities start to show up.
This is intended for informational purposes only and should not be used as the primary basis for an investment decision. Consult an advisor for your personal situation.
Indices mentioned are unmanaged, do not incur fees, and cannot be invested into directly.
Past performance does not guarantee future results.
The S&P 500 Index, or Standard & Poor’s 500 Index, is a market-capitalization-weighted index of 500 leading publicly traded companies in the U.S.