So, the Fed came out this week and reiterated that they’re keeping rates where they are for now. You know, watching the data, that kind of thing. But if you look at what the bond market’s doing, it’s saying something different—and that’s the topic of this week’s indicator.
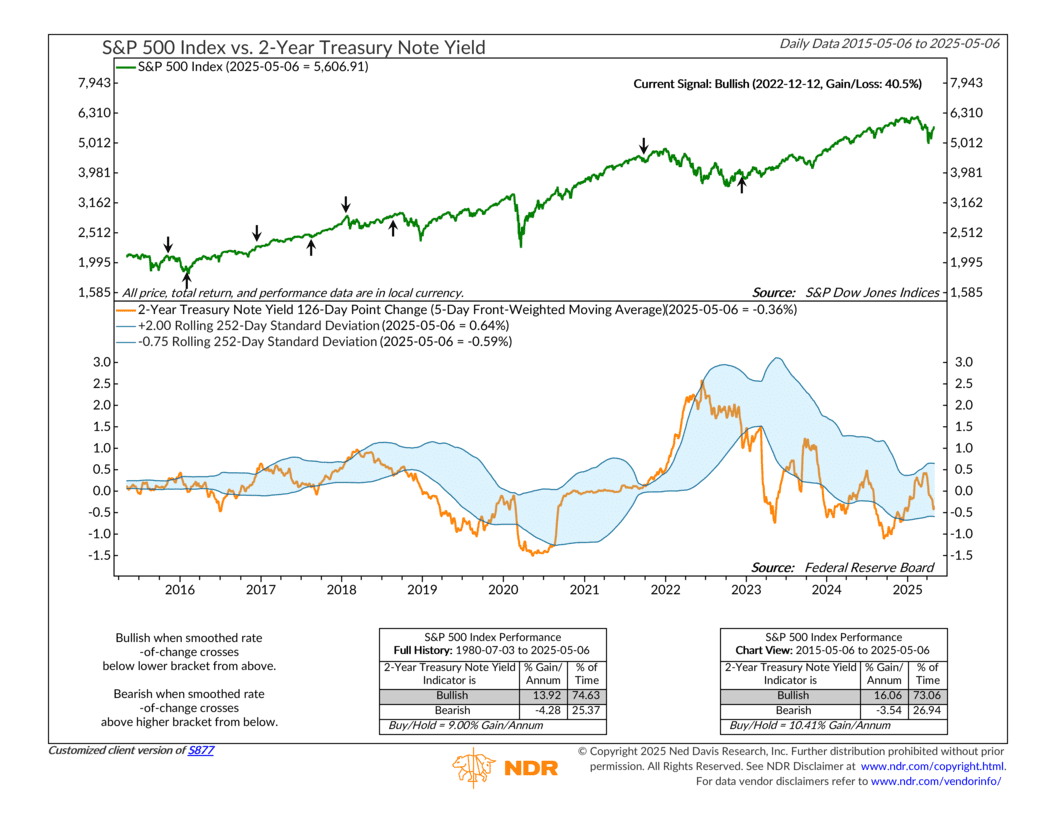
Let’s walk through it. The top half of the chart shows the S&P 500 in green. Nothing fancy there. But on the bottom half, the orange line shows how much the 2-Year Treasury yield is changing over a 126-day period, or about six months. It uses a five-day front-weighted moving average and rolling 252-day standard deviation bands. I know that’s a mouthful, but all you really need to know is that it helps show whether rates are generally trending up or down.
So why the 2-Year specifically? Because it’s the part of the curve most sensitive to Fed policy. If the Fed so much as hints at a move, the 2-Year is usually the first to react. In that way, it’s kind of like a toddler—quick to feel any shift in tone or direction.
How does the signal work? Well, you can think of those blue bands like guardrails. When the orange line drops below the lower band, it means the 2-Year yield is falling faster than usual. And that usually happens when investors think the Fed is going to cut rates.
That’s exactly what happened in late 2022. The orange line broke below the band, flipping the signal to bullish. Since then, the S&P 500 has climbed more than 40%. And that wasn’t a fluke. When this signal is bullish, stocks have historically done quite well—averaging around 16% per year. When it turns bearish, meaning the orange line jumps above the top band, returns tend to be a lot weaker.
So even though the Fed’s saying it’s not cutting yet, the market’s already pricing in something softer ahead. This indicator is basically saying, “Yeah, the Fed’s holding for now, but we see what’s coming.” And if history’s any guide, that could be good news for stocks.
This is intended for informational purposes only and should not be used as the primary basis for an investment decision. Consult an advisor for your personal situation.
Indices mentioned are unmanaged, do not incur fees, and cannot be invested into directly.
Past performance does not guarantee future results.
The S&P 500 Index, or Standard & Poor’s 500 Index, is a market-capitalization-weighted index of 500 leading publicly traded companies in the U.S.