Houston, we have thrust!
That’s right, this week’s indicator is all about thrust. But I’m not talking about a rocket ship—I’m talking about the stock market. Specifically, I’m referring to market breadth and how it can be used to generate an upside “thrust” signal.
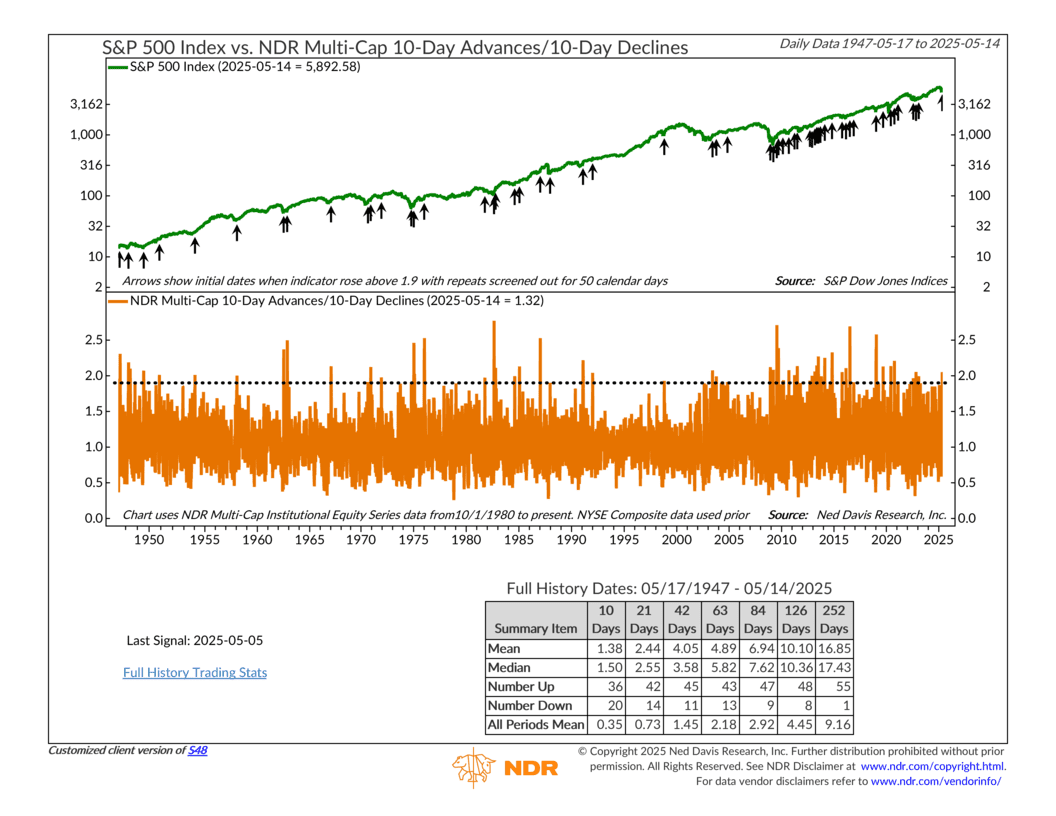
The green line on the top half of the chart shows the S&P 500 Index, our standard benchmark for the overall U.S. stock market. The orange line on the bottom is our indicator. It plots the ratio of the 10-day total of advancing issues to the 10-day total of declining issues. The daily data comes from the NDR Multi-Cap Institutional Equity Series starting in October 1980. Prior to that, it’s based on data from the New York Stock Exchange (NYSE).
So how does it work? The dashed horizontal line marks the threshold that’s been found to generate reliable thrust signals—ones that are typically followed by above-average gains in the S&P 500 over the next year. A signal is triggered when the 10-day advance/decline ratio moves above that line. Repeat signals within 50 calendar days are ignored.
The key insight? When advancing issues outnumber declining ones by a wide margin over a 10-day stretch, it tends to signal a meaningful shift in market momentum—and historically, it’s often been followed by further gains.
As you can see in the performance box below the chart, there have been 56 upside thrusts over the past 78 years. All but one led to gains in the following 12 months, with an average return of about 17%.
Looking at a shorter window—three trading months, which is the time frame we use—average returns have been around 5–6%, with gains coming about 77% of the time. That compares to a roughly 2% gain during all periods, thrust or no thrust. In other words, this is a pretty powerful signal—when it shows up.
And we just got one. After a two-year drought, a new bullish thrust signal fired on May 5th. Combined with a handful of other indicators, it’s helped push our primary risk model toward the more bullish side of the ledger.
The bottom line: breadth thrusts don’t happen often, but when they do, it usually means the market’s getting stronger.
This is intended for informational purposes only and should not be used as the primary basis for an investment decision. Consult an advisor for your personal situation.
Indices mentioned are unmanaged, do not incur fees, and cannot be invested into directly.
Past performance does not guarantee future results.
The S&P 500 Index, or Standard & Poor’s 500 Index, is a market-capitalization-weighted index of 500 leading publicly traded companies in the U.S.