We’ve seen more and more data suggesting that the US economy is slowing. Along with the data has come more and more calls that the US will soon enter a recession.
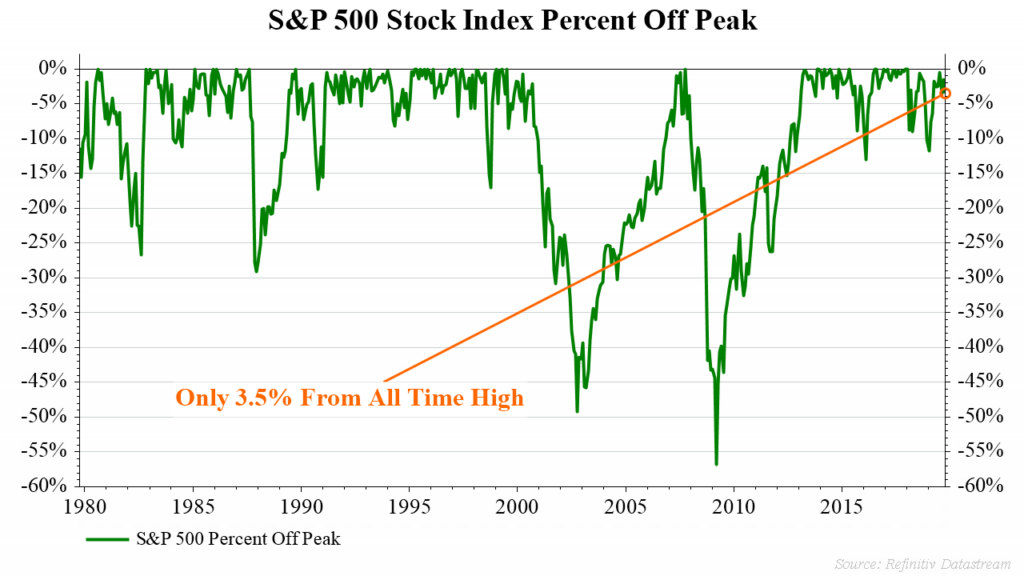
The above chart looks at the impact of this on the stock market (as represented by the S&P 500 stock index). It measures how far the current level is from the all time high level. A reading of 0% means that the index is at its peak. A reading of -10% means that the index has fallen and remains 10% below the prior high.
As seen, the S&P 500 index is just 3.5% from all time highs. While this doesn’t mean we can’t have a significant decline in the near future, it does suggest that stocks might deserve the benefit of doubt (at least for the time being) rather than rushing to make investment decisions based on the recent negative headlines.
Disclosure:
[content_block id=2017 slug=disclosure-index-reference][content_block id=2019 slug=disclosure-index-performance]