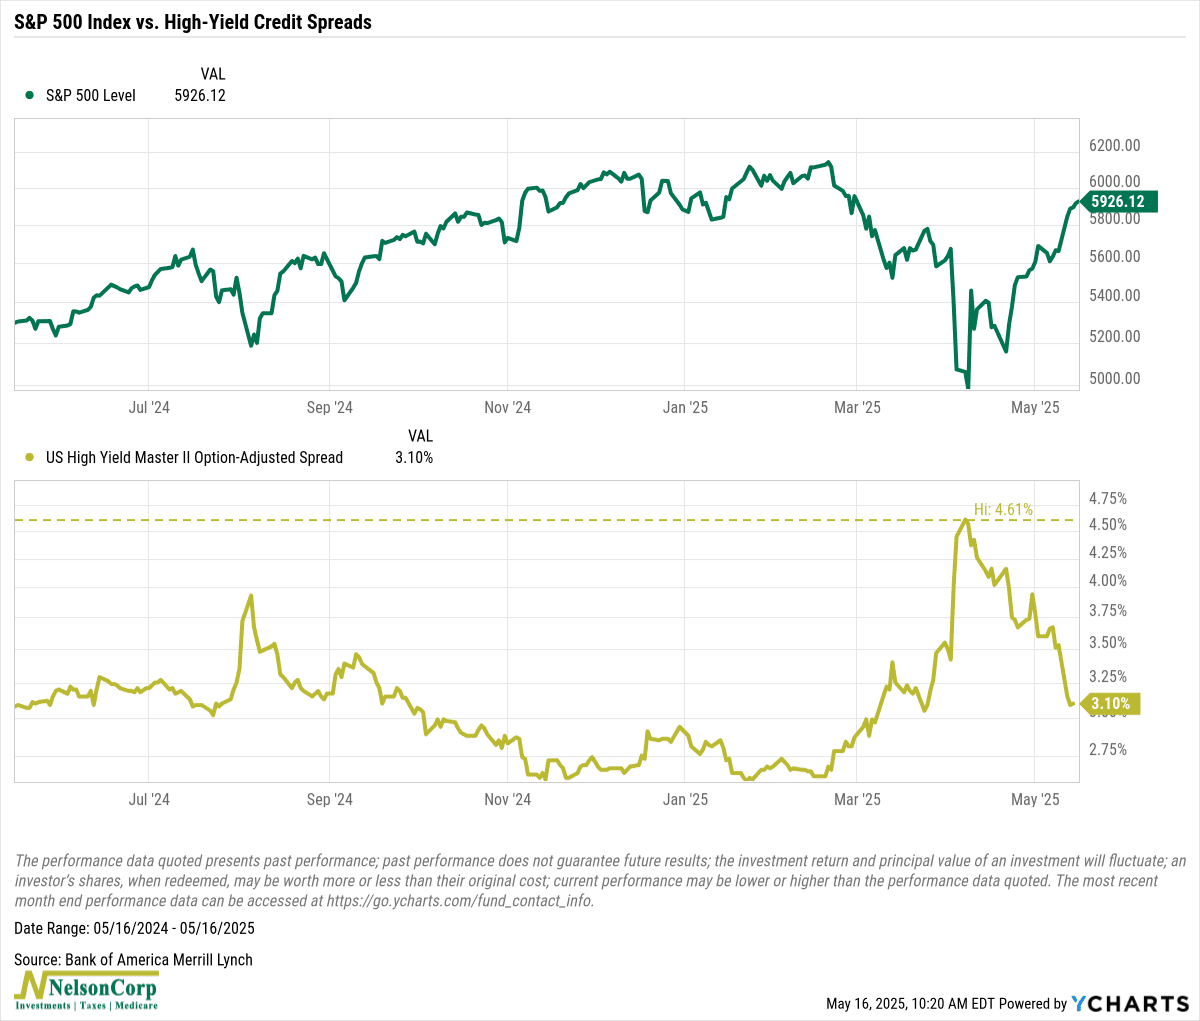
After a sharp spike in early April, credit spreads are once again signaling smooth sailing in the bond market—and by extension, the stock market.
The chart above shows U.S. high yield spreads tightening sharply—down 151 basis points since peaking at 4.61% on April 7. As of this week, they’ve dropped to 3.10%, levels that typically suggest confidence and calm.
Why does this matter? Credit spreads reflect the premium investors demand for holding riskier bonds over Treasuries. When they widen, it often signals rising fear of defaults or recession. When they narrow—as they have now—it tells us investors see a stable environment with low credit risk and strong economic footing.
In short, the bond market has flipped back to “risk on,” echoing the optimism we’ve seen lately in stocks.
This is intended for informational purposes only and should not be used as the primary basis for an investment decision. Consult an advisor for your personal situation.
Indices mentioned are unmanaged, do not incur fees, and cannot be invested into directly.
Past performance does not guarantee future results.
The S&P 500 Index, or Standard & Poor’s 500 Index, is a market-capitalization-weighted index of 500 leading publicly traded companies in the U.S.
The U.S. High Yield Master II Option-Adjusted Spread Index measures the average additional yield over Treasury securities that investors demand to hold U.S. high-yield (junk) bonds. It is not investable and does not reflect the performance of any specific investment.