This week’s chart shows that when it comes to profitability in the stock market, the big just keep on getting better.
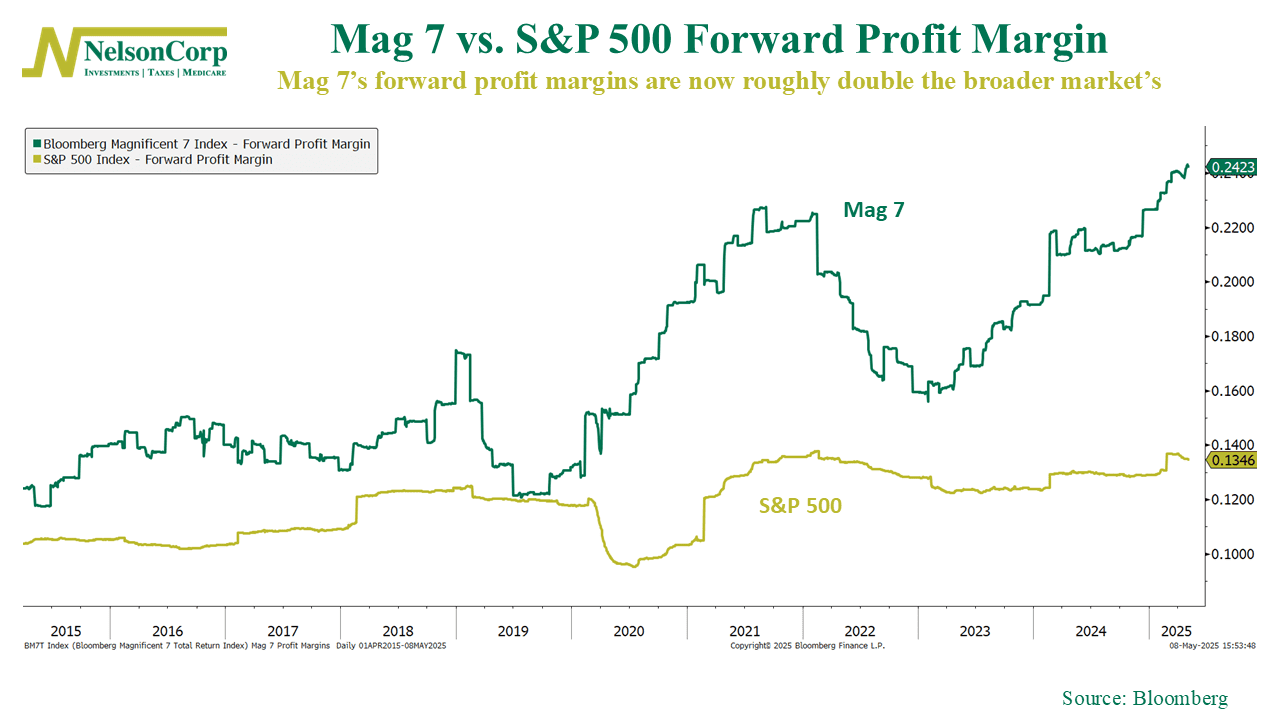
What do I mean? Well, this week’s chart shows the forward (expected) profit margins of the seven largest tech companies in the S&P 500 (collectively known as the Magnificent 7) versus the S&P 500 itself. And what stands out immediately is the dramatic divergence that’s been building over the past two years.
As of April 2025, the collective forward profit margin for the Mag 7 has reached an all-time high of over 24%. That’s roughly double the 13% forward profit margin of the S&P 500 as a whole.
This widening gap explains much of the market’s recent concentration. When a small group of companies can consistently convert revenue to profit at rates so far above average, they naturally attract capital despite premium valuations.
However, this concentration creates real risk. With so much of the market’s strength depending on just a handful of companies maintaining these record profit margins, any disappointment could trigger broader selling. If these tech leaders stumble—whether from competition, tariffs, or simply hitting growth limits—the impact could quickly spread throughout the market.
So for now, the margins are holding—but the stakes are getting higher.
This is intended for informational purposes only and should not be used as the primary basis for an investment decision. Consult an advisor for your personal situation.
Indices mentioned are unmanaged, do not incur fees, and cannot be invested into directly.
Past performance does not guarantee future results.
The S&P 500 Index, or Standard & Poor’s 500 Index, is a market-capitalization-weighted index of 500 leading publicly traded companies in the U.S.
The Bloomberg Magnificent 7 Index is a market-cap-weighted index consisting of seven U.S. mega-cap technology and technology-adjacent companies selected by Bloomberg for their outsized influence on equity markets.