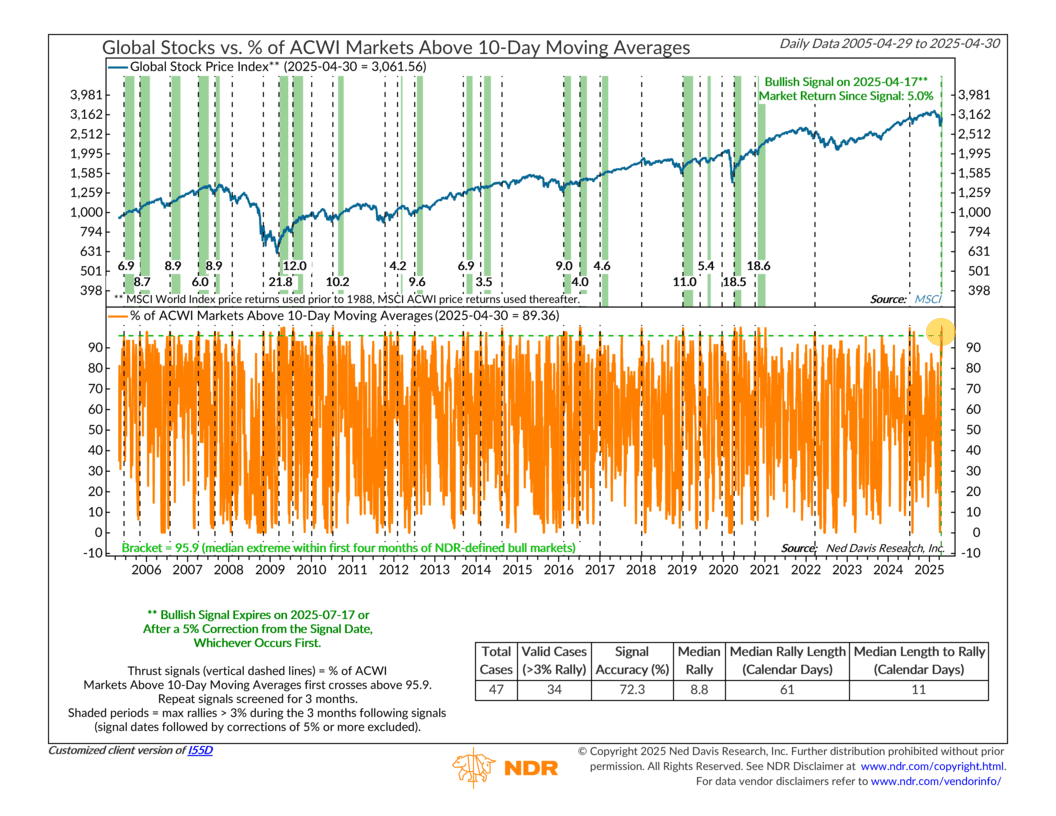
After a rocky few months to start the year, we finally got some good news a few weeks ago: a global breadth thrust.
What’s that? Simply put, it’s when a big chunk of global stocks all start moving higher at the same time—and in a relatively short period.
In the case of this week’s indicator (shown above), it happens when the percentage of global stock markets trading above their average 10-day level climbs to 96% or more.
It doesn’t happen often. And to count, the surge has to be the first one in at least three months. But when it does happen, it usually signals a meaningful shift in market momentum.
Since 1972, there have been 47 signals like this one. In 34 of those cases—about 72% of the time—stocks went on to gain at least 3% in the months that followed. The median gain? 8.8%. Median rally length? About three months.
As you can see in the chart, this measure of global breadth dropped all the way to 0% on April 8th. But just nine days later, it shot up to 100%. In other words, every single stock market in the MSCI All-Country World Index was trading above its 10-day average. That’s rare—and impressive.
And we’re already off to a solid start. Since the April 17th signal, global stocks have climbed 5%. That lines up well with what history says tends to happen after these kinds of thrusts.
This signal will remain active for three months, or until global stocks drop 5% from the signal date—whichever comes first.
In the meantime, we’ll be watching closely for more thrust signals to show up from other thrust indicators like this one. The more confirmation we get, the more likely it is that this rally has legs. As they say, the more the merrier—and the more we see, the more the weight of the evidence will continue to shift toward the bulls.
This is intended for informational purposes only and should not be used as the primary basis for an investment decision. Consult an advisor for your personal situation.
Indices mentioned are unmanaged, do not incur fees, and cannot be invested into directly.
Past performance does not guarantee future results.
The MSCI ACWI captures large and mid cap representation across 23 Developed Markets and 24 Emerging Markets countries. With 2,935 constituents, the index covers approximately 85% of the global investable equity opportunity set.
