This week’s indicator tracks drawdowns in both stocks and bonds.
What’s a drawdown? It’s just a fancy way of saying how far something has fallen from its peak. It measures the drop from the high point to the low point. You can kind of think of it like a measure of pain.
The idea here is that by looking at the combined drawdown across both stocks and bonds—the combined pain—we can get a better sense of the overall market environment and whether things are starting to turn the corner.
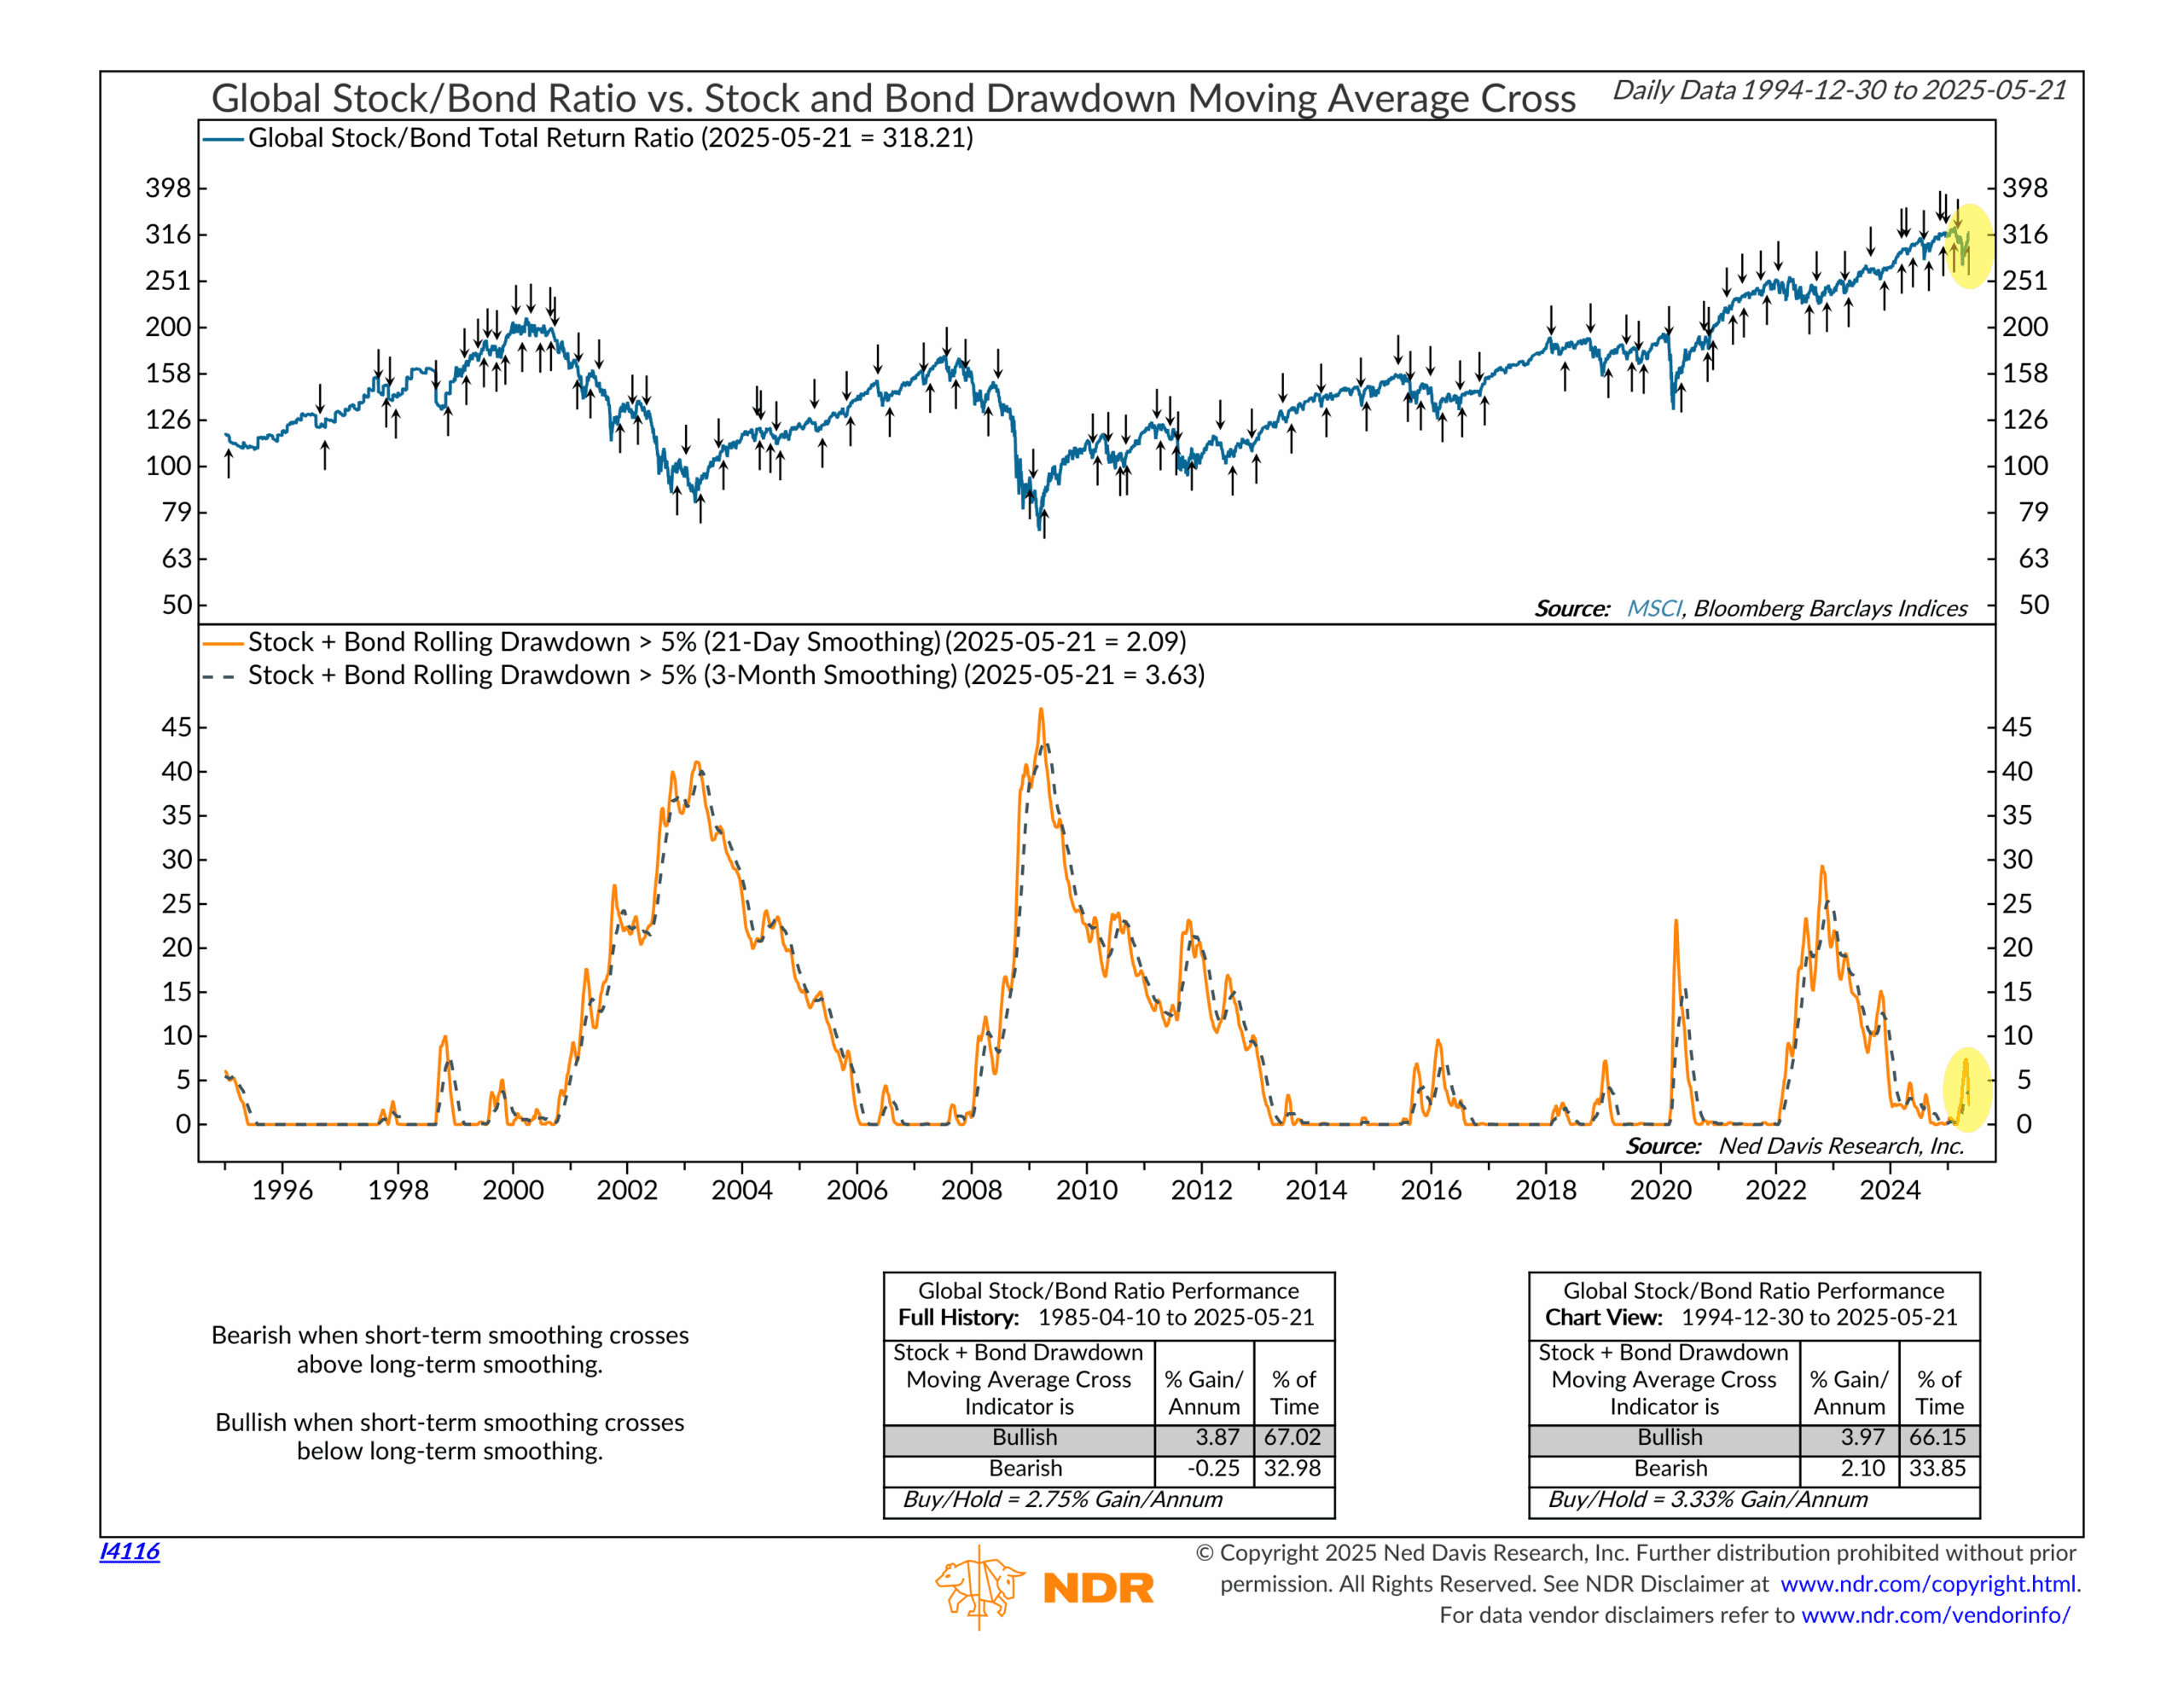
The green line on the top half of the chart shows the ratio of total returns for global stocks versus global bonds. When the line is rising, stocks are outperforming. When it’s falling, bonds are doing better.
Now take a look at the bottom half of the chart. That’s our indicator. It tracks the trend of the combined rolling drawdown in stocks and bonds when losses exceed five percent. The signal turns bullish when the short-term (21-day) smoothing drops below the long-term (3-month) smoothing—and turns bearish when the short-term crosses back above.
That’s the big idea. When short-term damage starts improving faster than long-term damage, it’s usually a sign that markets are stabilizing—and vice versa.
And that’s exactly how it’s played out in past cycles. In early 2003, the signal flipped bullish just as markets were bottoming after the dot-com crash. It happened again in early 2009, right before the next bull market took off. And in 2020, it helped confirm that the COVID crash was in the rearview mirror.
As of May 21st, it’s happening again. The short-term drawdown smoothing just fell below the long-term average—a sign that the recent weakness might be fading.
And the historical record supports that idea. Since 1985, the stock/bond ratio has gained at a 3.87% annualized rate during bullish signals, compared to a -0.25% loss during bearish ones.
Bottom line? This signal has a solid track record of catching turning points. With another bullish reading now in place, the market looks to be on better footing.
This is intended for informational purposes only and should not be used as the primary basis for an investment decision. Consult an advisor for your personal situation.
Indices mentioned are unmanaged, do not incur fees, and cannot be invested into directly.
Past performance does not guarantee future results.
The S&P 500 Index, or Standard & Poor’s 500 Index, is a market-capitalization-weighted index of 500 leading publicly traded companies in the U.S.