OVERVIEW
It was a mixed week for U.S. stocks last week. While the Nasdaq had a terrible week, dropping 5.52%, the Dow stayed positive with a 0.01% gain. The S&P 500 split the difference and fell 3.05%.
The market downturn was not limited to the United States; foreign stocks also had a challenging week, with developed country markets witnessing a 2.33% drop and emerging markets experiencing a more significant 3.6% fall.
Bond prices also dipped as the yield on the benchmark 10-year Treasury rose to 4.63%. Overall, bonds fell about 0.6% for the week.
In the real asset space, we saw real estate decline by around 3.3%, whereas commodities increased by around 0.13%. This was led by gold, which rose 1.67%, versus a 3.29% decline in oil prices. The U.S. dollar strengthened about 0.2%.
KEY CONSIDERATIONS
A Dangerous Leap – The famous stunt performer Evel Knievel once said, “Risk is good. Not properly managing your risk is a dangerous leap.”
When applied to investing, I couldn’t agree more with that statement. Risk is necessary for investing. Without risk, you don’t get a return. But if you don’t manage that risk appropriately, it could also result in disaster.
That’s why we use a process called Risk Aware Investing to better understand and manage risk to our advantage. To do this, we utilize indicators, which are kind of like guideposts that help us determine the overall risk level in the market.
So, what are the guideposts saying now?
Well, for the first time in several months, the stock market is on the defensive, and that means we’ve started to see some deterioration in a few of our price-based indicators.
For example, the chart below shows that we recently got a “sell” signal from an indicator that measures momentum reversals in the stock market. Specifically, it uses a calculation called the 252-day rate of change of the S&P 500 (smoothed by ten days) and compares it to its rolling 63-day standard deviation bands to determine when momentum is beginning to shift.
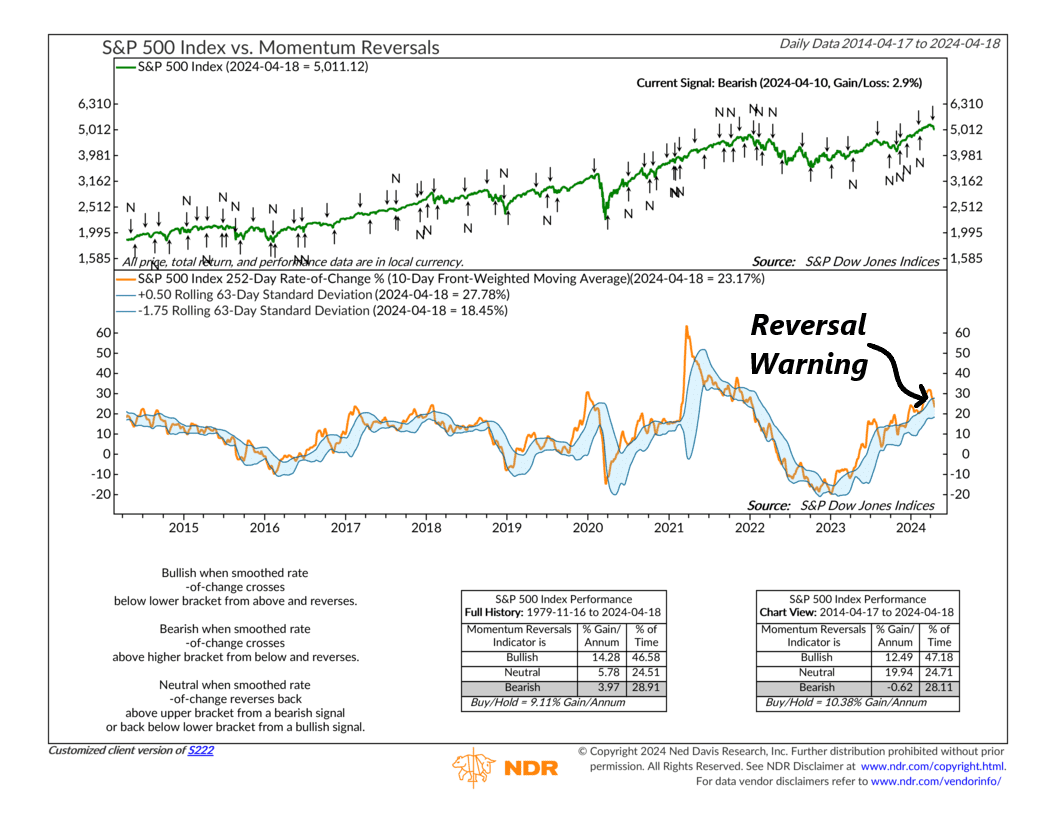
Best case scenario? We see this measure turn around and neutralize the recent “sell” signal. It’s done this multiple times over the past few months as the market has pushed higher, and it could certainly happen again.
However, there is one area that could keep the market from regaining its footing, and this has to do with the next chart showing the S&P 500’s Price-to-Earnings ratio. This is a metric commonly used to determine whether the market is overvalued or not. As you can see, it jumped into the upper zone last quarter, suggesting that stocks are now overvalued after the recent rally.
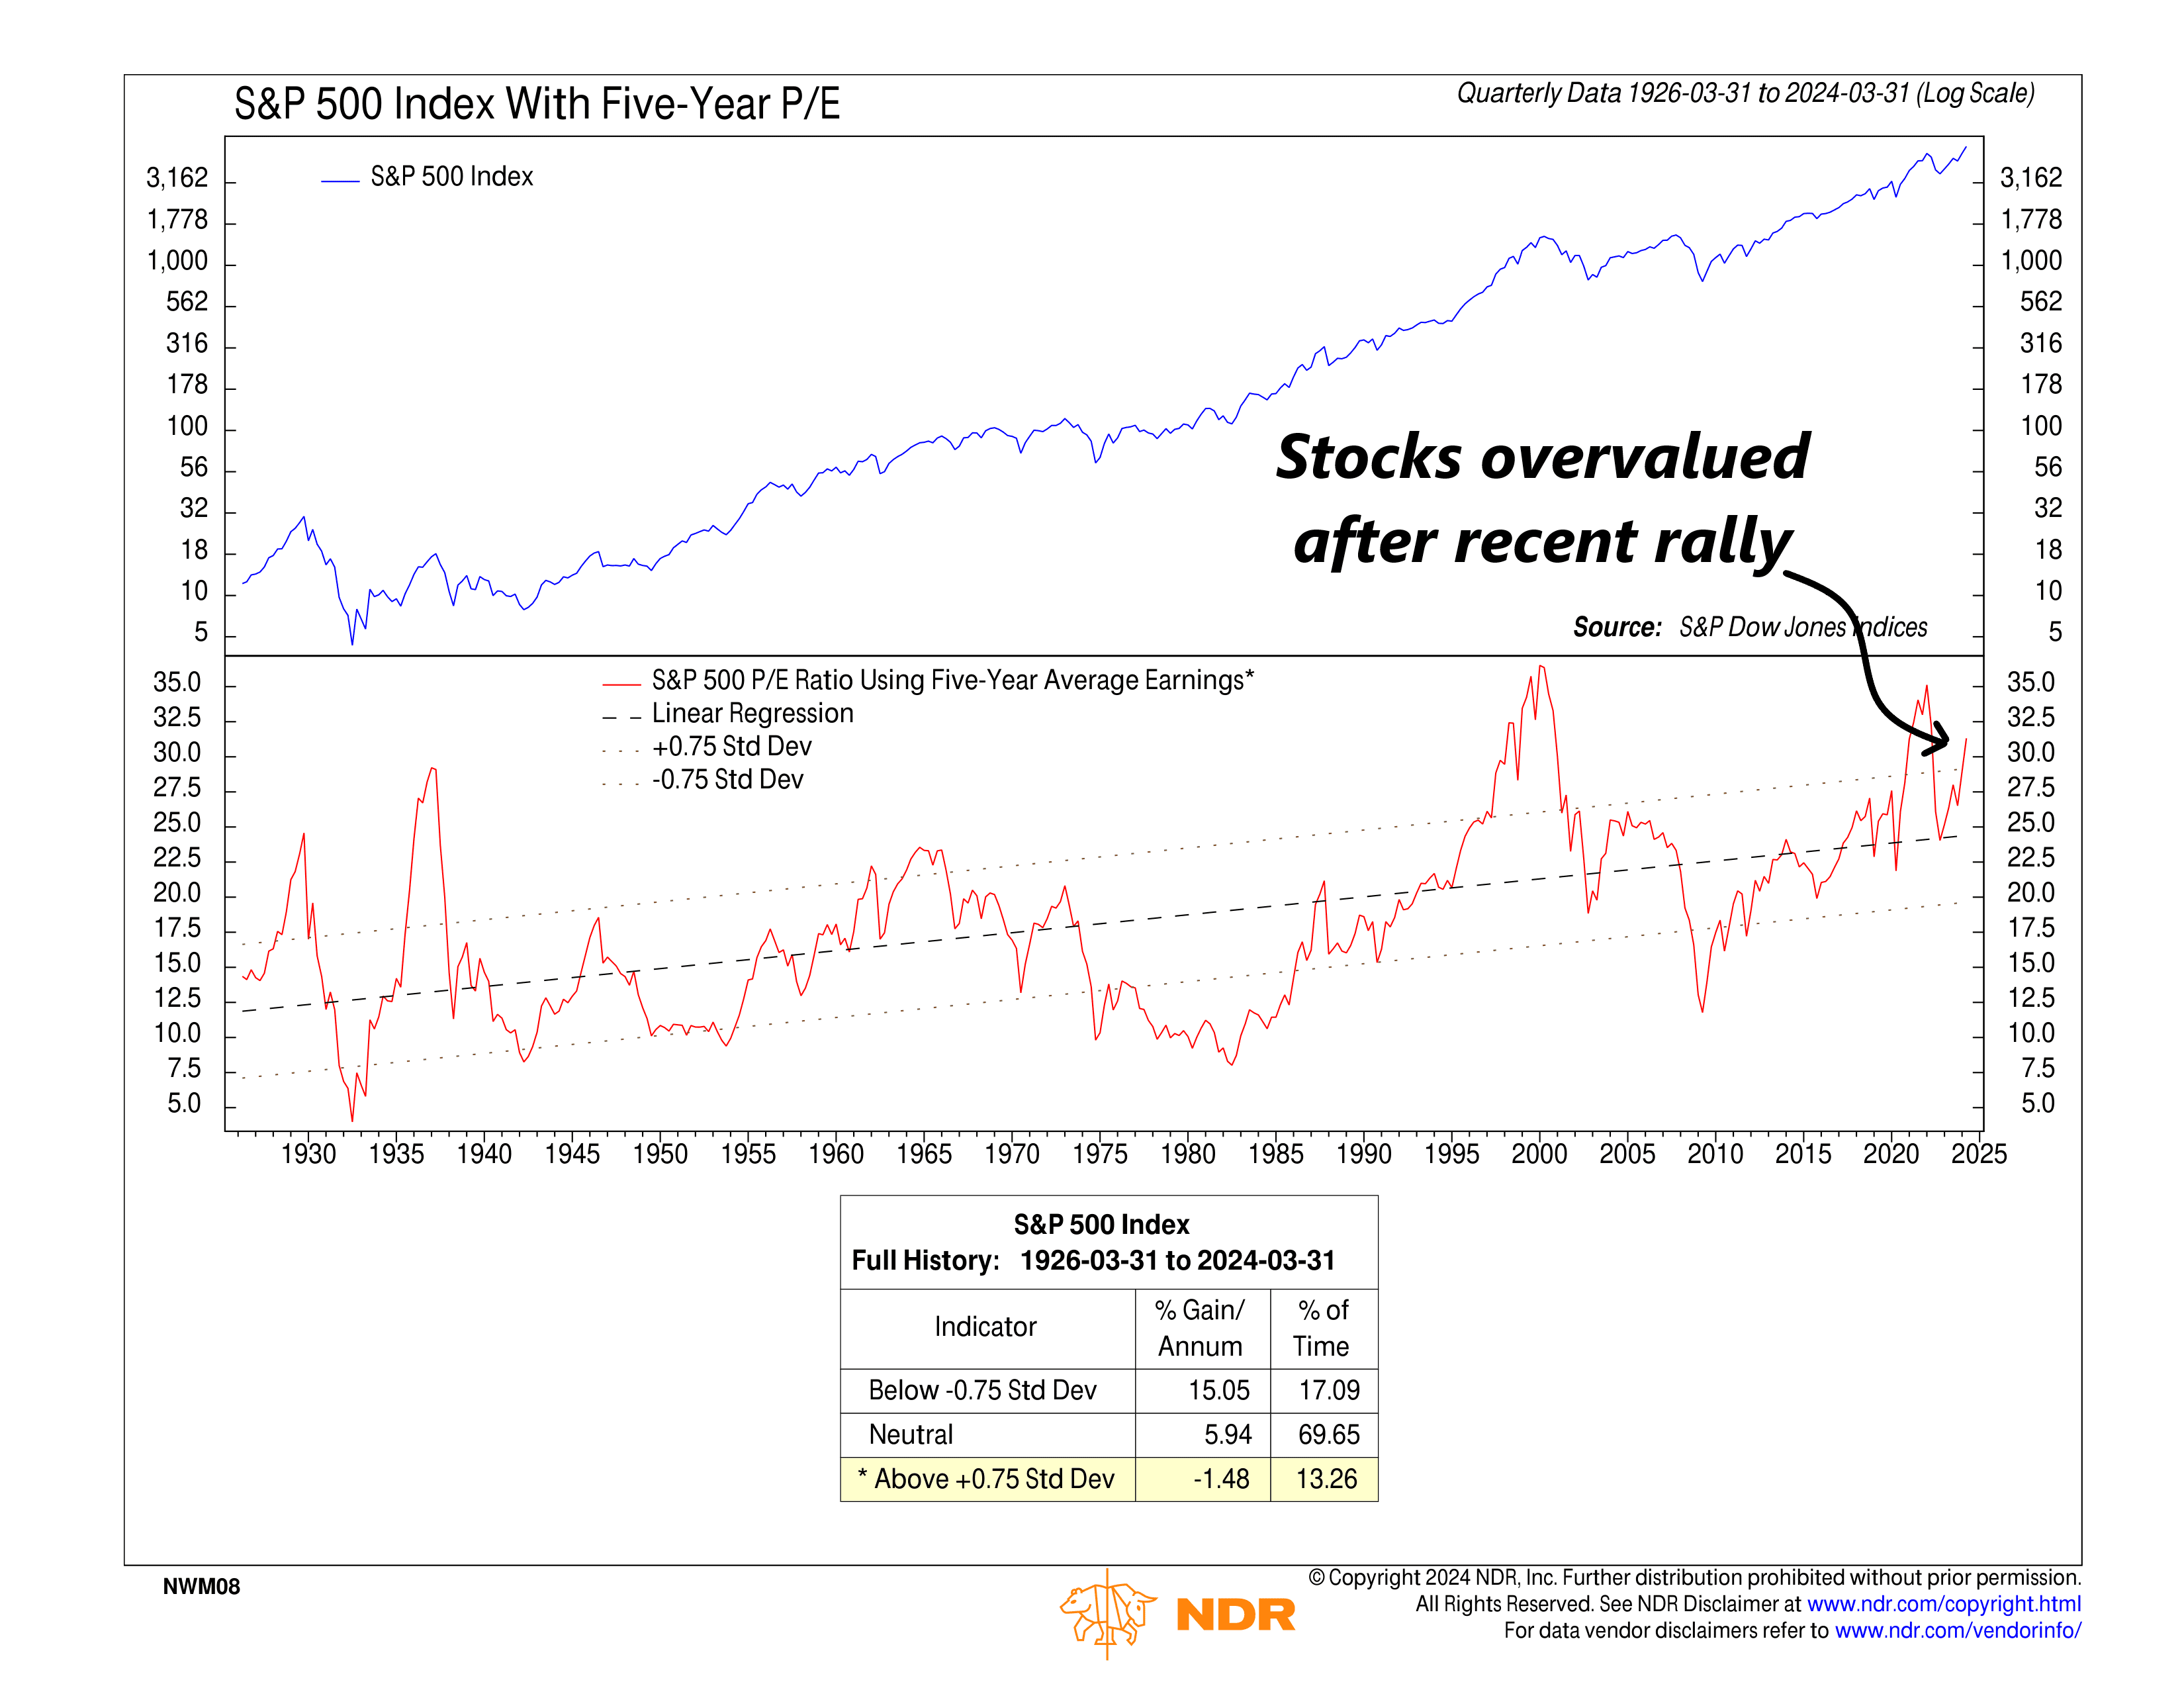
Does this mean stocks are now doomed? Of course not. Stocks can stay overvalued by such measures for a very long time. But eventually, the P/E ratio does tend to revert to its long-run average, either by prices decreasing or earnings increasing.
Which brings us to the next chart. Maybe prices won’t have to drop as much if earnings increase? Well, according to the middle clip of the chart below, S&P 500 earnings are expected to grow nearly 13% year-over-year by the end of the year. More so, the momentum—or point change—of that earnings growth is expected to stay positive (bottom clip).
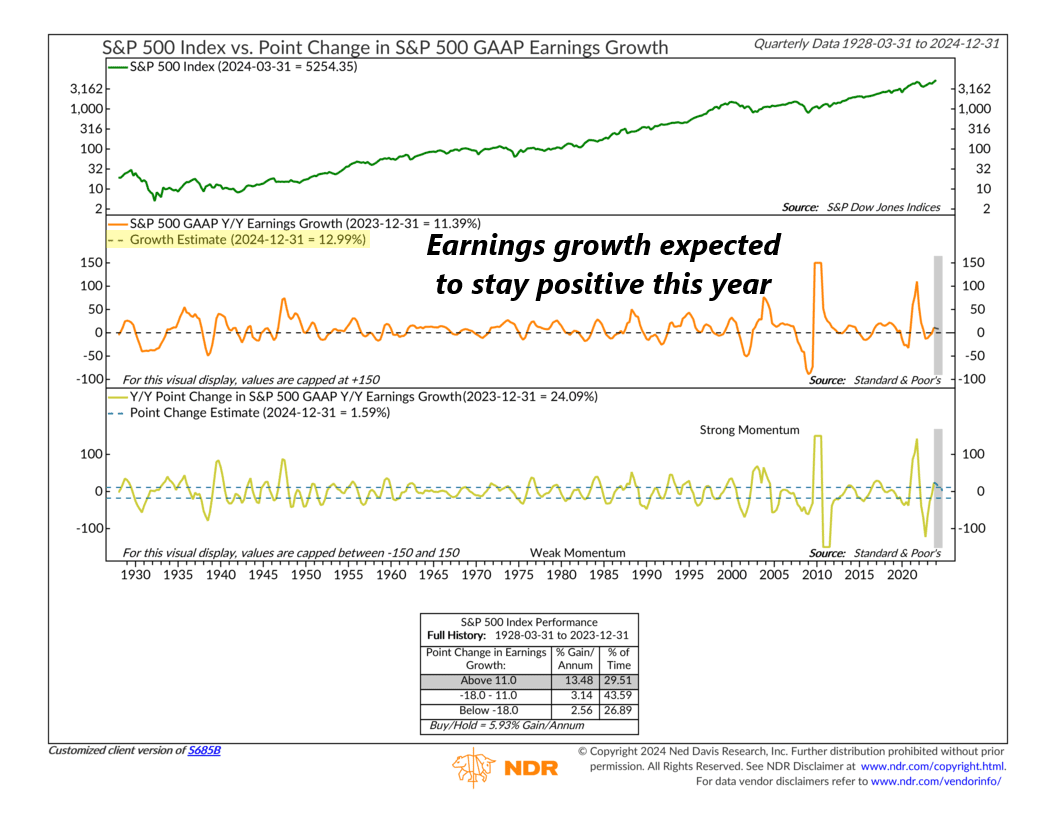
Historically, stocks have loved those sorts of bullish earnings conditions. But you know what else stocks love? A golden cross. A golden cross is a term used to describe a technical condition in which a stock market index, like the S&P 500, has a 50-day average price higher than its 200-day average price. As you can see on the chart below, that remains the case.
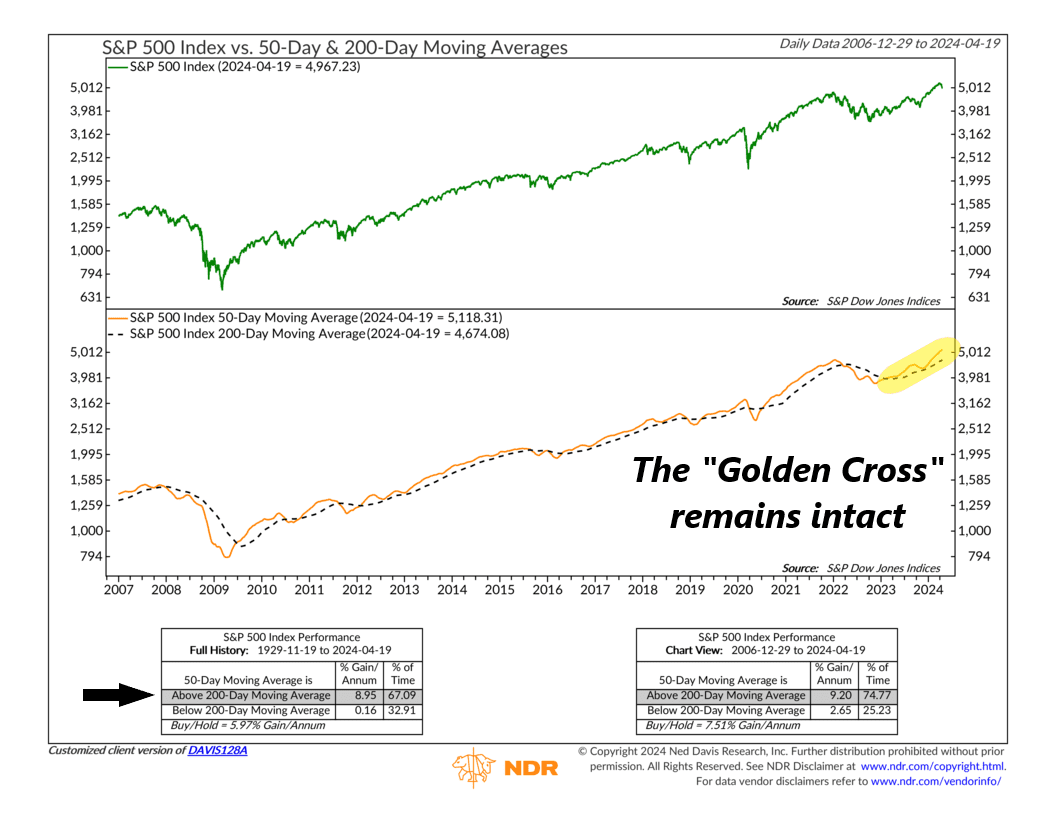
The fact that the S&P 500’s current index level of 4967 is below its 50-day average of 5118 is slightly concerning. However, if we look at market history, a threat to the market’s long-term uptrend isn’t really at risk until we see the 50-day average level drop below its much longer 200-day average level.
That’s where taking market risk becomes what Knievel would call a “dangerous leap.” But for now, the bottom line is that the weight of the evidence continues to point to a moderately “safe” or bullish environment for risk assets like stocks.
This is intended for informational purposes only and should not be used as the primary basis for an investment decision. Consult an advisor for your personal situation.
Indices mentioned are unmanaged, do not incur fees, and cannot be invested into directly.
Past performance does not guarantee future results.
The S&P 500 Index, or Standard & Poor’s 500 Index, is a market-capitalization-weighted index of 500 leading publicly traded companies in the U.S