OVERVIEW
U.S. stocks had mixed results for the week. The Nasdaq increased slightly by 0.07%, while the S&P 500 and the Dow both decreased by 0.8% and 1.24%, respectively.
In terms of stock types, growth stocks experienced a slight increase of around 0.12%, while value stocks dropped by 1.68%. Small caps also decreased by approximately 0.8%.
On the other hand, foreign stocks fared better, with developed country stocks rising 0.04% and emerging markets gaining 0.47%.
The bond market had a varied performance, with the 10-year Treasury rate remaining steady at around 3.4%. Short-term and intermediate-term Treasuries increased by approximately 0.08%, while long-term Treasuries fell by around 1.2%. Investment-grade corporate bonds and high-yield bonds also experienced losses of about 0.6% and 0.38%, respectively.
Real estate and commodities had a rough week, with real estate losing around 0.4% and commodities broadly decreasing by 1.3%. This was primarily due to the significant drop in oil prices, which fell by 6.6%. However, gold rose by 1.48% and corn increased by 1.97%. The U.S. dollar weakened by about 0.3% against major world currencies.
KEY CONSIDERATIONS
Concentration Risk – There’s some concern out there that the stock market lacks breadth. By that, it’s meant that only a handful of stocks within an index like the S&P 500 are participating in the rally or doing well, while the rest are performing poorly.
One way to illustrate this dynamic is via the chart below, which shows the performance of the traditional market-cap-weighted S&P 500 Index versus the equal-weighted version of the same index.
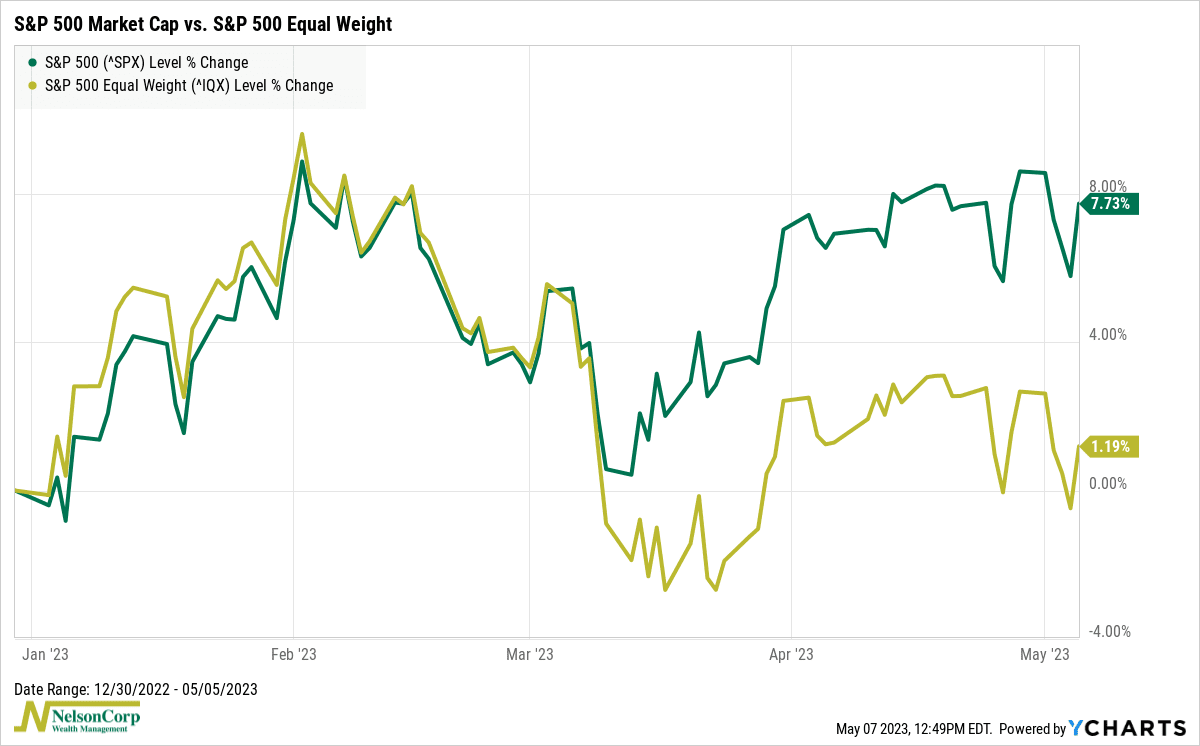
As you can see, the regular cap-weighted index is outperforming the equal-weight version by roughly 6.5% year-to-date. This is one of the widest spreads on record. Conventional wisdom would say that narrow leadership like this is bearish for the stock market.
Pulling on that same thread, we have another indicator that we use to measure breadth in a slightly different way. It’s called the Combination High-Low Logic Index, shown below.
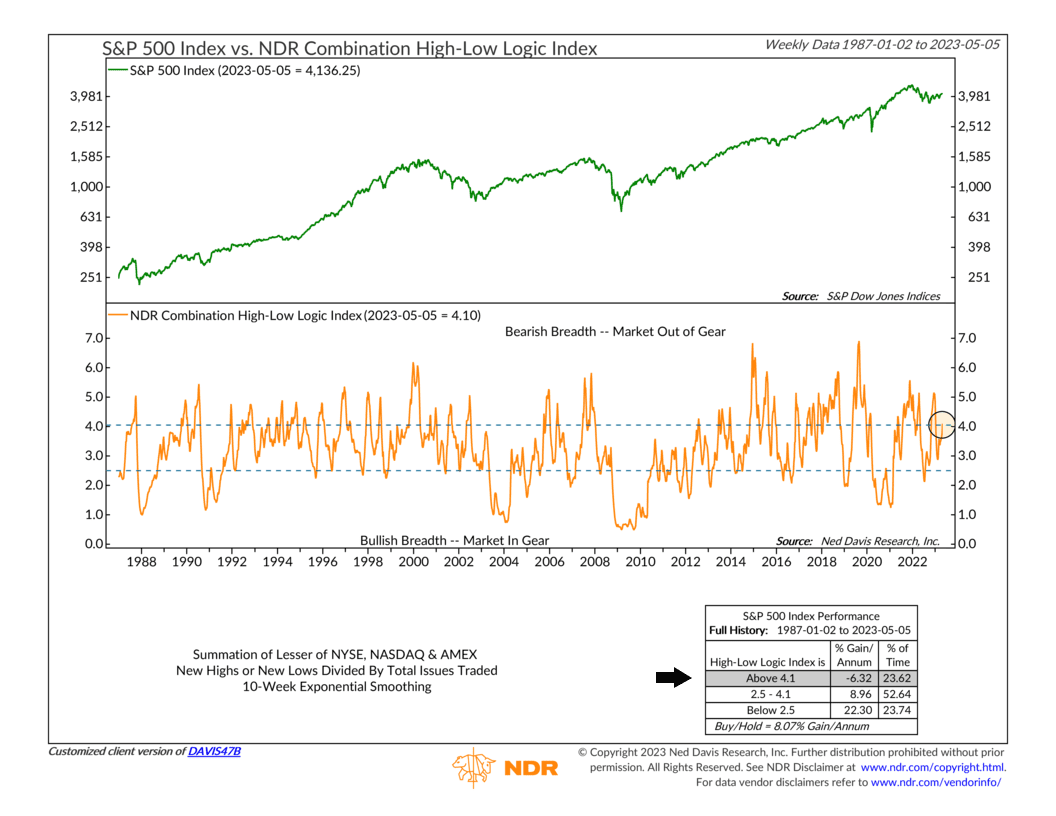
Its purpose is to determine whether the stock market is “in-gear” or not. It does this by adding up whichever is less—stocks at new highs or new lows—and dividing it by the total number of issues traded (smoothed by ten weeks). When the indicator is low, it means the market is in gear. But when the indicator is high—like it is now—it’s a sign of an out-of-gear market.
In other words, a high reading from this indicator is a sign that a lot of stocks are making new highs while a lot of stocks are also making new lows. We call this a divergent market with “bad breadth,” and historical returns for the S&P 500 Index come in around -6.3% per year, on average, when this is the case.
So, the main takeaway from all this is that the stock market is in a vulnerable state right now, with a high amount of concentration risk (only a few stocks contributing to overall gains) and poor breadth, as evidenced by an “out of gear” market. Of course, that doesn’t mean the stock market can’t keep rising from here. But these sorts of issues are holding our models back from getting too bullish at the moment.
This is intended for informational purposes only and should not be used as the primary basis for an investment decision. Consult an advisor for your personal situation.
Indices mentioned are unmanaged, do not incur fees, and cannot be invested into directly.
Past performance does not guarantee future results.