OVERVIEW
The U.S. stock market rose further into record territory last week. The S&P 500 index gained 1.83%, the Dow Jones Industrial Average rose 1.61%, and the Nasdaq Composite surged 2.43%.
International stocks continued their recent outperformance versus U.S. stocks. Developed country stocks rose roughly 3.5%, and emerging market stocks gained over 5.5%.
Bonds had a rough week, as the yield on the U.S. 10-year Treasury note rose to 1.12%, a 20 basis point gain from the previous week’s close of 0.92%. Only high-yield bonds, which tend to act more stock-like, managed to tread water for the week.
Oil had a big week, gaining more than 7.5%. Corn prices also rose between 2-3% for the week. Gold, however, suffered a weekly loss of around 3%.
The U.S. dollar showed some strength, gaining around 0.15% for the week.
KEY CONSIDERATIONS
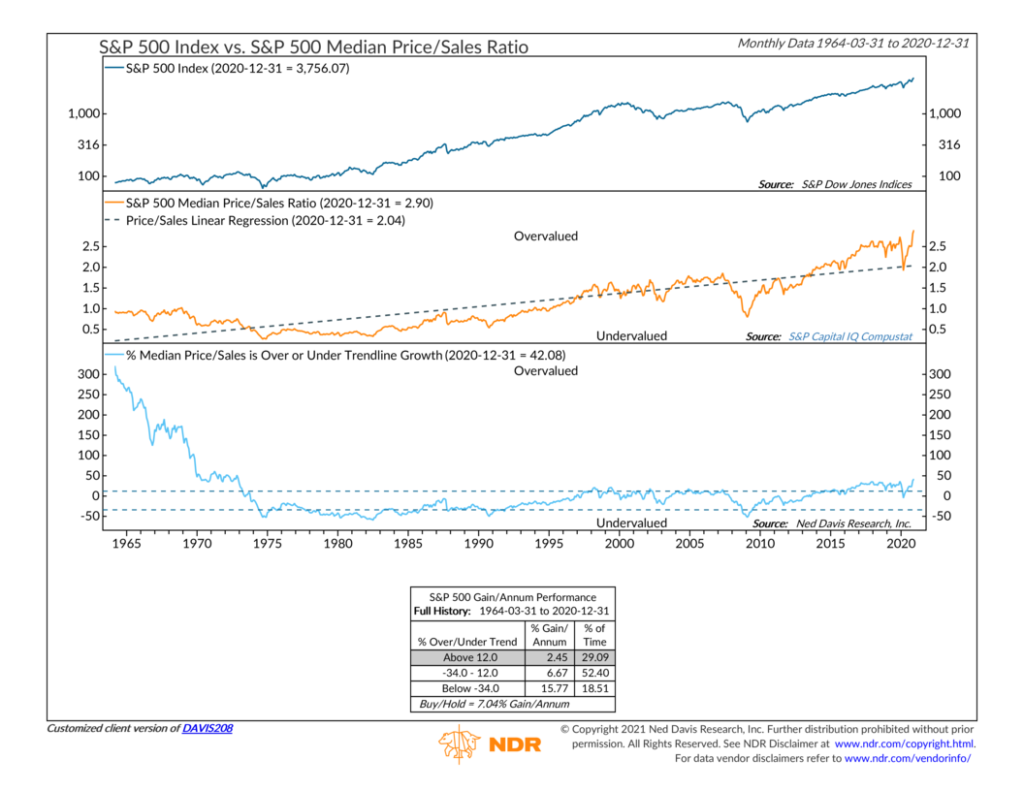
Don’t Look Down – From a traditional valuation standpoint, the stock market looks a bit bubbly right now. By this, I mean that the current prices investors are paying for stocks are, by some measures, historically high relative to the cash flows of the underlying businesses.
For example, the median price/sales ratio for the S&P 500 stock index ended 2020 at a record high of 2.9 times, as shown in the middle clip of the chart below. In other words, investors are willing to pay $2.90 for every $1 in revenue that the average large company in the U.S is generating.
But is that good or bad?
Looking at the price/sales ratio over time, we see that it is rising. To determine whether stocks are overvalued or not, the bottom clip in the chart measures the current price/sales ratio relative to its long-term trend line, which is the linear regression (dotted line) in the middle clip.
When the price/sales ratio is 12% or more higher than its long-term trend, stocks have generally struggled relative to their long-term average return, gaining about 2.45% per annum compared to the average historical return of 7.04%.
As of the end of 2020, the price/sales ratio of the average stock in the S&P 500 index was more than 42% above the long-term trend line. Yikes!
With that said, this type of analysis doesn’t take into account the historically low interest rate environment we currently find ourselves in. Low interest rates lower the discount rate that is applied to the future cash flows that companies are expected to generate, thus making the present value of stock prices higher.
Nonetheless, this and other measures of valuation are useful in determining sentiment in the market. A rising price/sales ratio is indicative of improving investor confidence, which is a powerful force that can drive stock prices higher in the short term, as we see now. However, once sentiment reaches an extreme, the risk of large price corrections increases greatly.
This is intended for informational purposes only and should not be used as the primary basis for an investment decision. Consult an advisor for your personal situation.
Indices mentioned are unmanaged, do not incur fees, and cannot be invested into directly.
Past performance does not guarantee future results.