OVERVIEW
Last week, U.S. stocks tumbled to their lowest level since November 2020. The S&P 500 fell 2.9% to close the week and is now down 25.2% from its January 3rd closing high. The Dow Jones Industrial Average also dropped 2.9% for the week, and the Nasdaq Composite fell 2.7%.
Foreign stocks have fared even worse than U.S. stocks this year, down nearly 30% year-to-date. For the week, developed country stocks fell another 1.6%, and emerging markets plunged 3.3%.
Bond prices dropped as interest rates moved higher for the week. The 10-year yield rose to 3.8% versus its close of 3.7% the week before. Short-term Treasuries rose 0.05%, intermediate-term Treasuries fell 0.7%, and long-term Treasuries tumbled 2.95%. Investment-grade corporate bonds lost 1.9%, high-yield (junk) bonds dropped 1.4%, and municipal bonds fell 0.75%. TIPS traded down 2.45%.
Commodities held up relatively better but were still down around 0.8% broadly. Oil inched lower by 0.06%, gold rose nearly 1%, and corn saw a slight gain of about 0.1%. And finally, the U.S. dollar actually weakened last week, falling about 0.6% against the world’s major currencies.
KEY CONSIDERATIONS
Extreme Sentiment – Sentiment in the stock market has been really gloomy lately. In fact, it’s been downright in the toilet.
But, from a contrarian perspective, this is a positive thing we look for. Historically, stock markets tend to bottom when pessimism is at its highest.
Indeed, many of the sentiment-tracking indicators we monitor have flashed positive signals recently.
For example, in our Indicator Insights blog post, we pointed out that the 5-day total ratio of puts-to-calls has reached extremely pessimistic levels, levels last seen near the bottom of the 2020 stock market crash.
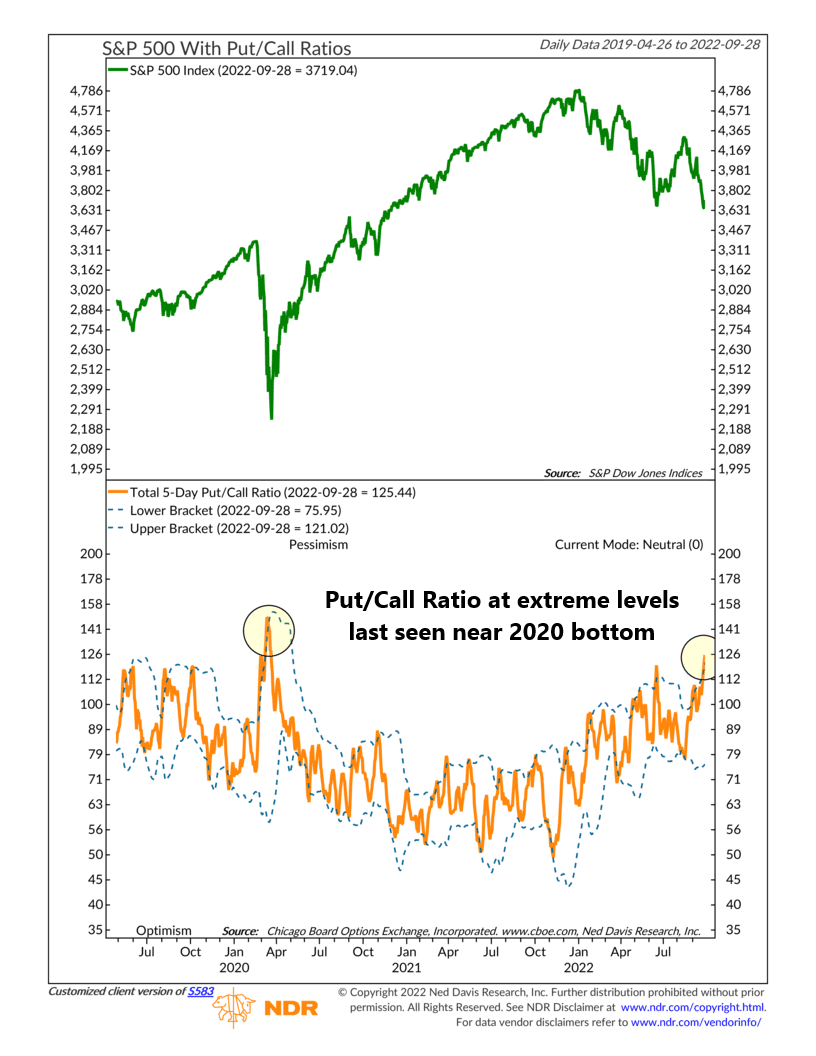
In other words, sentiment has become lopsided, and everyone is betting stocks will go down. Historically, the opposite tends to happen when this is the case.
Backing this up are sentiment surveys, which reveal an overwhelming feeling of pessimism among investors.
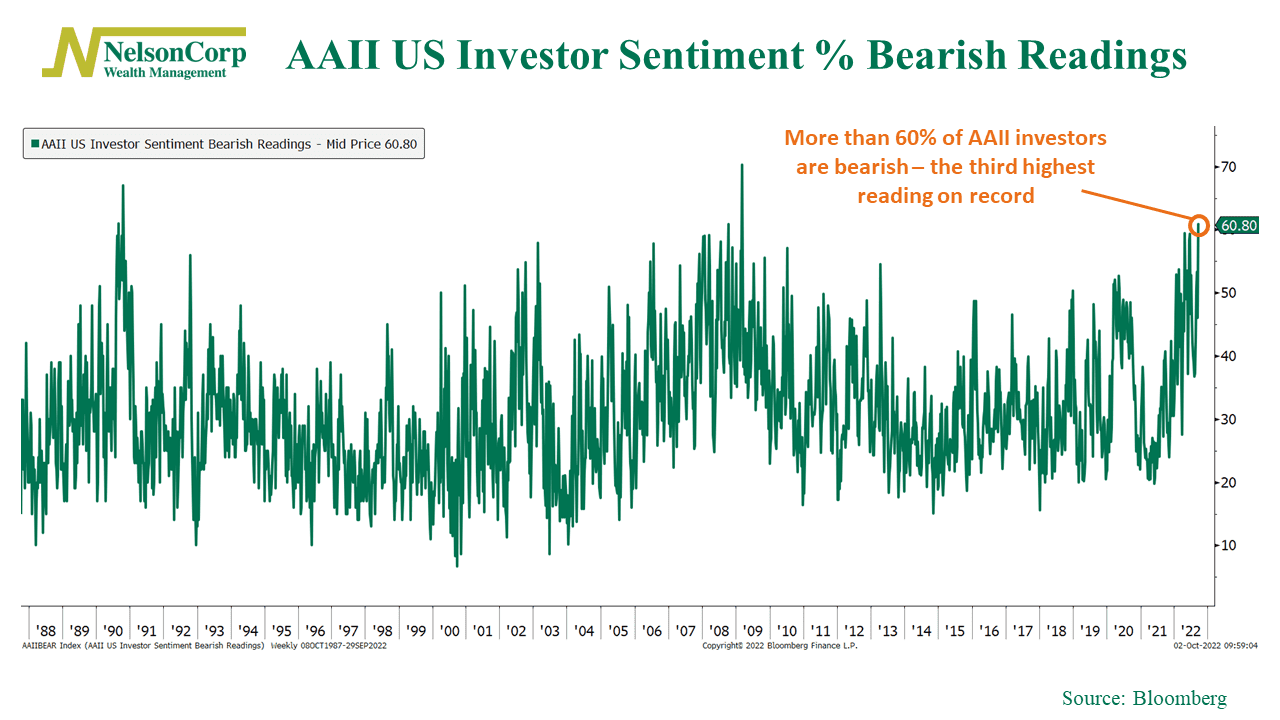
According to one prominent survey, shown on the chart above, the percentage of investors who have “bearish” outlooks for the stock market over the next six months has climbed to over 60%. This is the third highest reading on record, going back to 1987.
So that’s the good news. Sentiment is terrible, and that has the potential to be good for future stock returns.
But here’s the bad news: the stock market’s trend looks really ugly, and the price action we’ve seen all year is the sort of price action we see when we’re in a bear market. It’s hard to get too excited about negative sentiment when prices are clearly in a downtrend.
The last line of defense? It might be the 200-week moving average of the S&P 500, shown as the orange dashed line on the chart below.
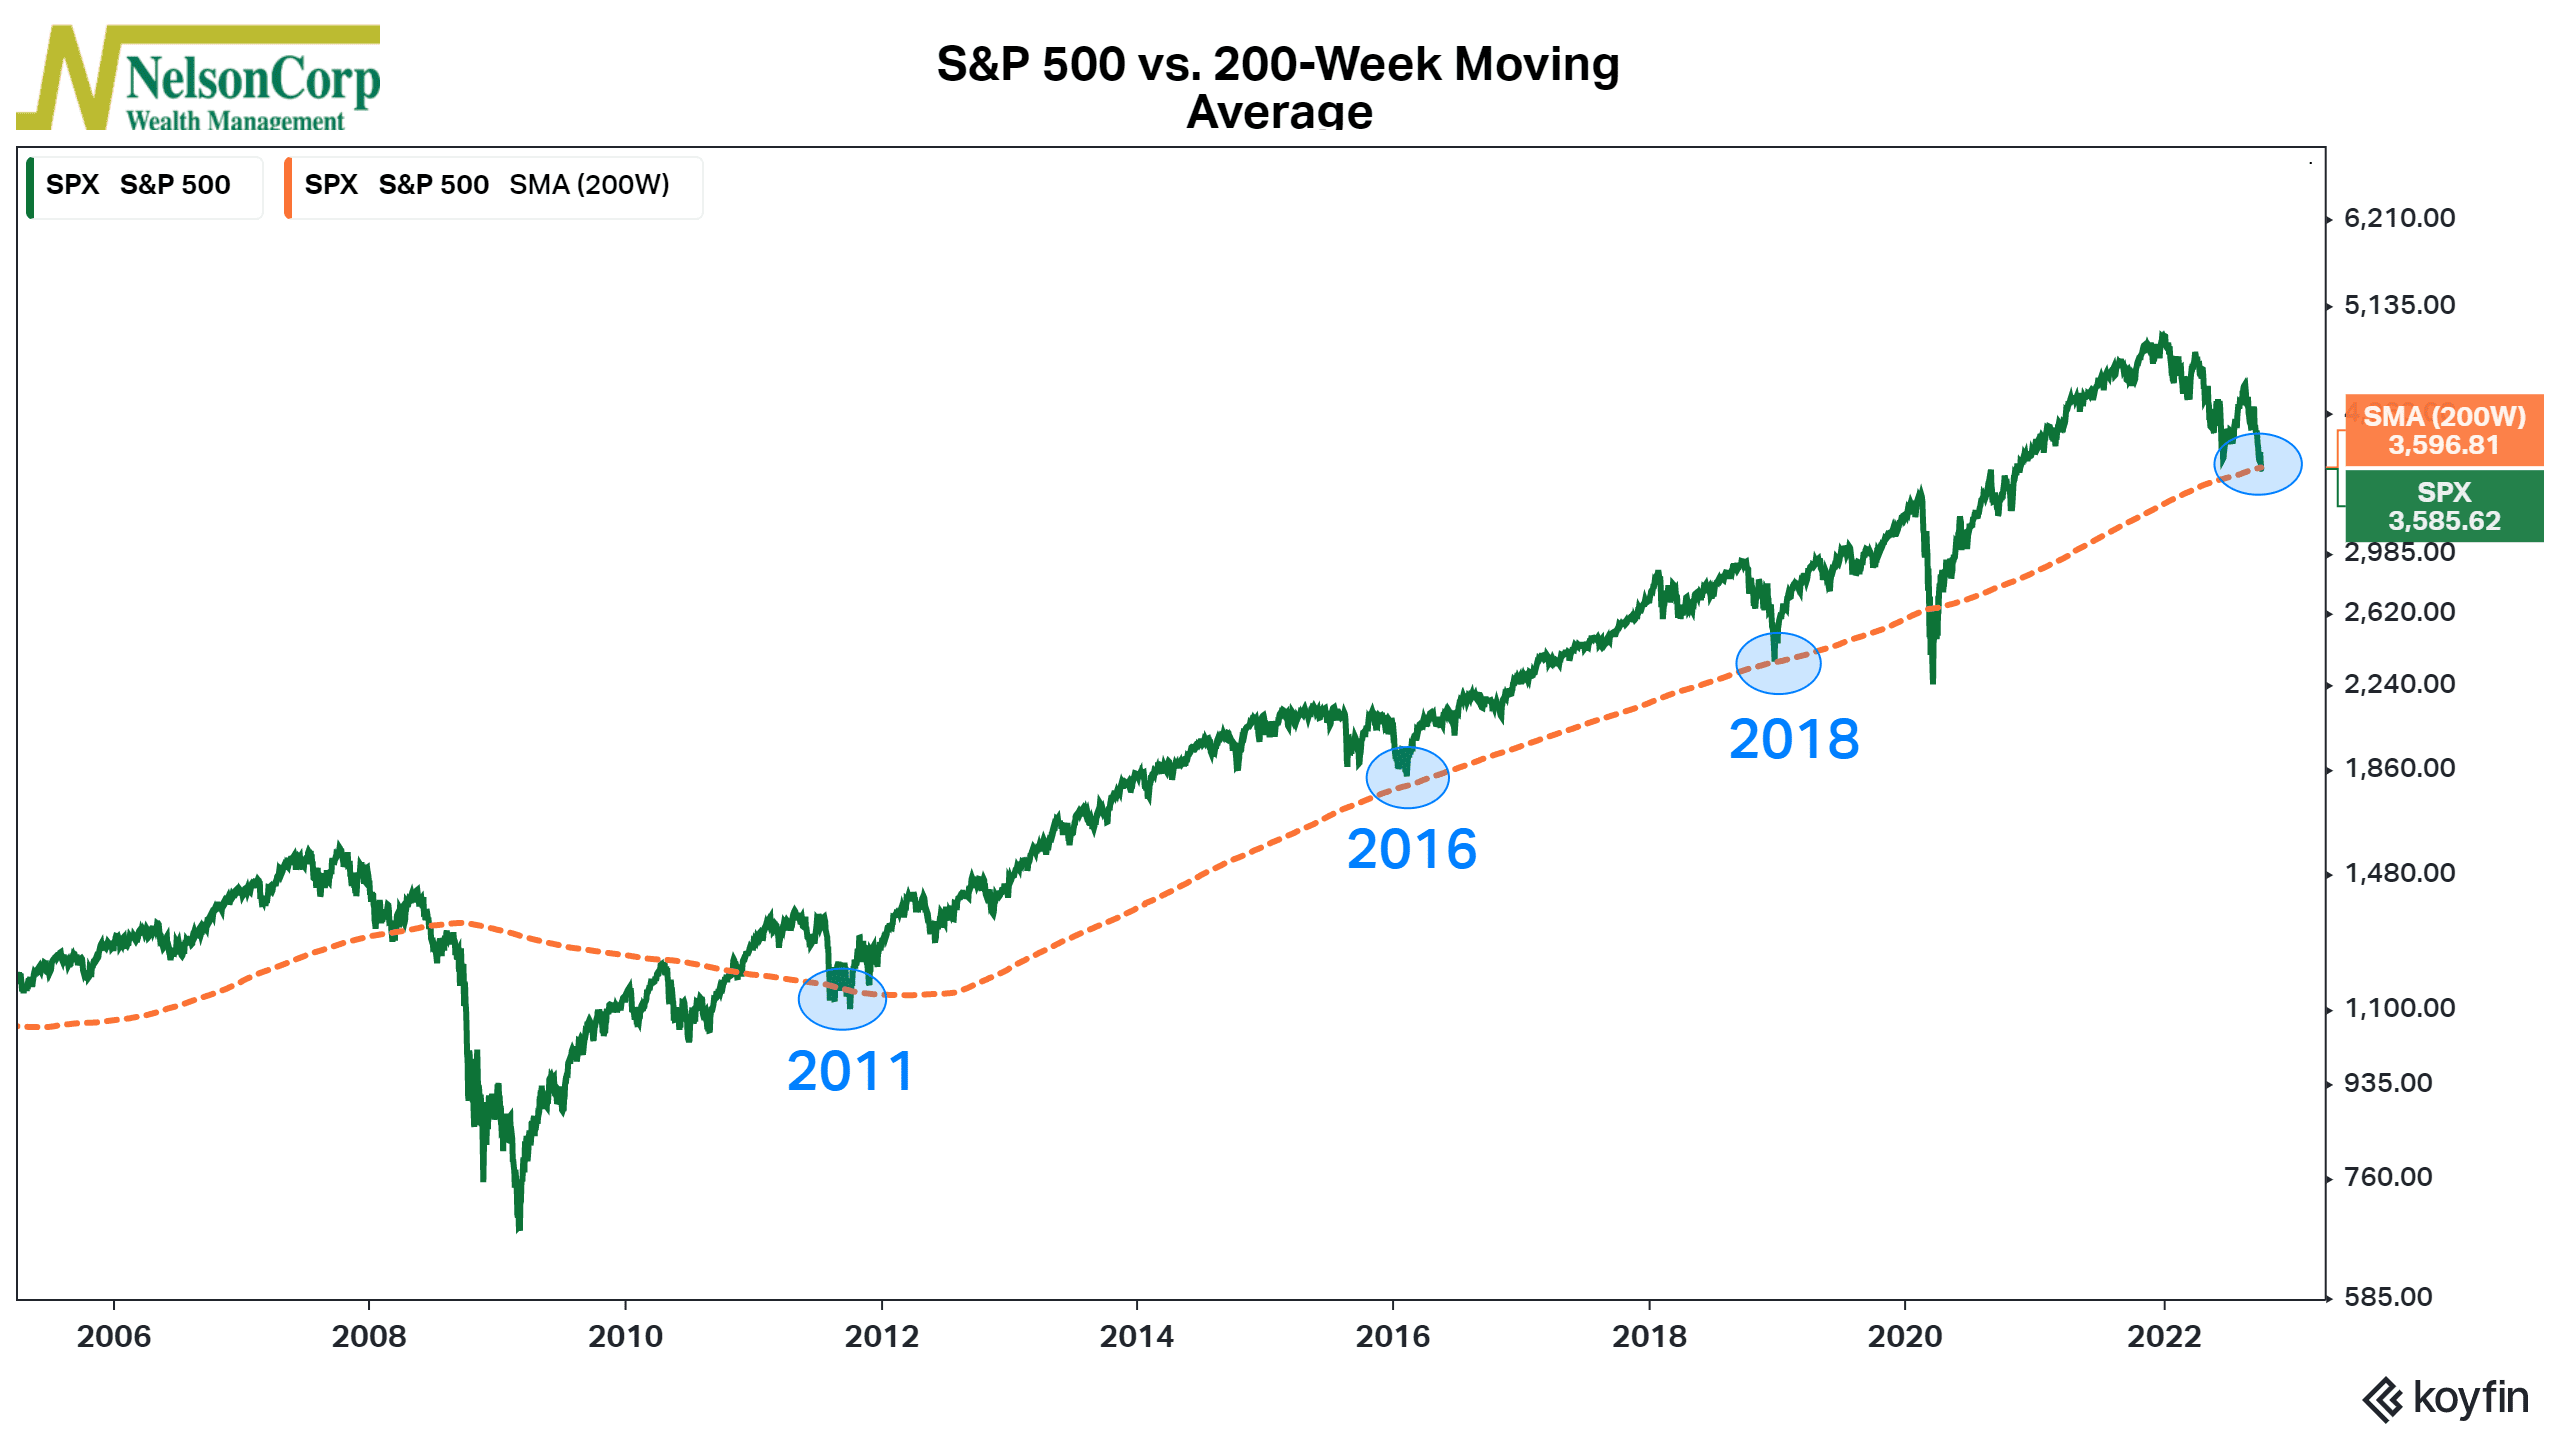
This represents the very long-term trend of the stock market. It’s the average price of the S&P 500 stock index over the past roughly 4 years. The green line is the actual S&P 500.
In 2008, prices fell significantly below the 200-week moving average, and the stock market crashed.
In contrast, during the subsequent bull market, prices rebounded after reaching the 200-week moving average multiple times—2011, 2016, and 2018—and thus avoided a price crash.
Last week, the S&P 500 fell just below its 200-week moving average. This could be a critical moment for the stock market this year. The optimist in me would like to see these levels hold, but having a game plan in case they don’t seems sensible.
This is intended for informational purposes only and should not be used as the primary basis for an investment decision. Consult an advisor for your personal situation.
Indices mentioned are unmanaged, do not incur fees, and cannot be invested into directly.
Past performance does not guarantee future results.