OVERVIEW
The U.S. stock market ended the week on a positive note with all three major indices turning green for the week. The S&P 500 climbed 0.87%, the Dow rose 0.86%, and the Nasdaq gained 1.28%.
Growth and large-cap stocks led the way, gaining 0.99% and 1.31%, respectively. Value stocks rose 0.25%, and small caps lost 1.03% for the week.
Foreign stocks experienced small declines, with developed country stocks dropping approximately 0.11% and emerging markets falling about 0.38%.
Bonds had a strong outing as interest rates fell. The benchmark 10-year yield fell to 3.4% from 3.57% the week before. Treasury prices gained across the board as a result. Investment-grade corporates also rose about 0.87%, and high-yield (junk) bonds increased 0.49%.
Real estate prices rose by approximately 1.13%, while commodities experienced a broad decline of about 1.2%. Specifically, oil dropped 1.04%, corn fell 4.92%, but gold rallied 0.43%. The U.S. dollar remained unchanged for the week.
KEY CONSIDERATIONS
Falling Correlations and Downbeat Managers – It was another mostly sideways kind of week for the U.S. stock market. For the most part, it seems investors are still a bit uncertain as to where they want to go next with equities.
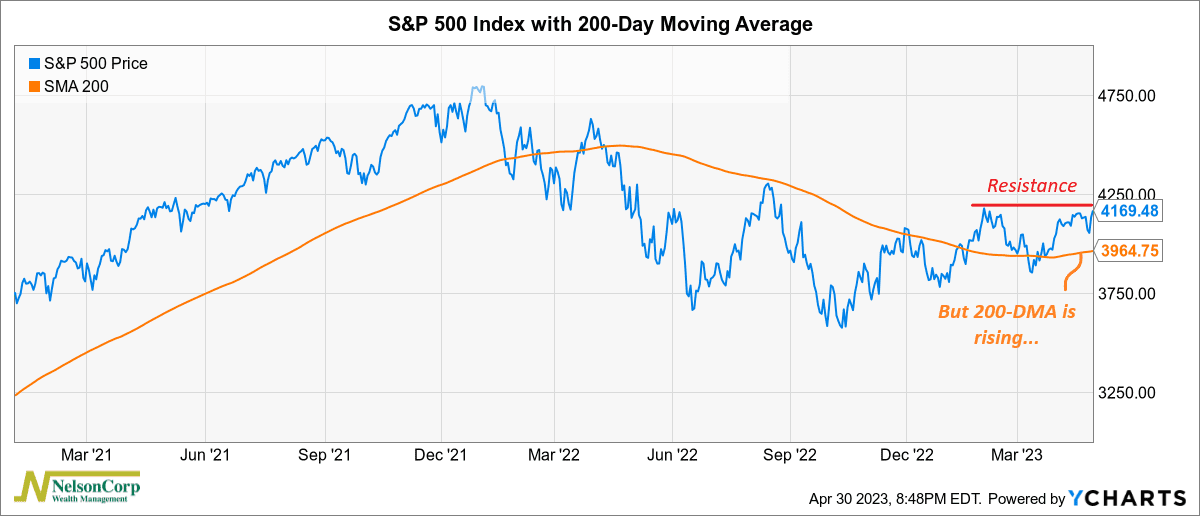
On the one hand, the S&P 500 Index is still feeling resistance at about the 4180 level on the index. But on the other hand, the S&P 500 remains well above its 200-day moving average—which also happens to be rising.
But while it seems like the market is sort of lost, we do see some pockets of encouraging news.
For example, as we highlighted for this week’s Chart of the Week, investors are getting less nervous around macro events such as inflation data releases and Fed policy announcements. In fact, to piggyback off that theme, the kind of lockstep moves that gripped stocks last year have been fading rapidly this year.
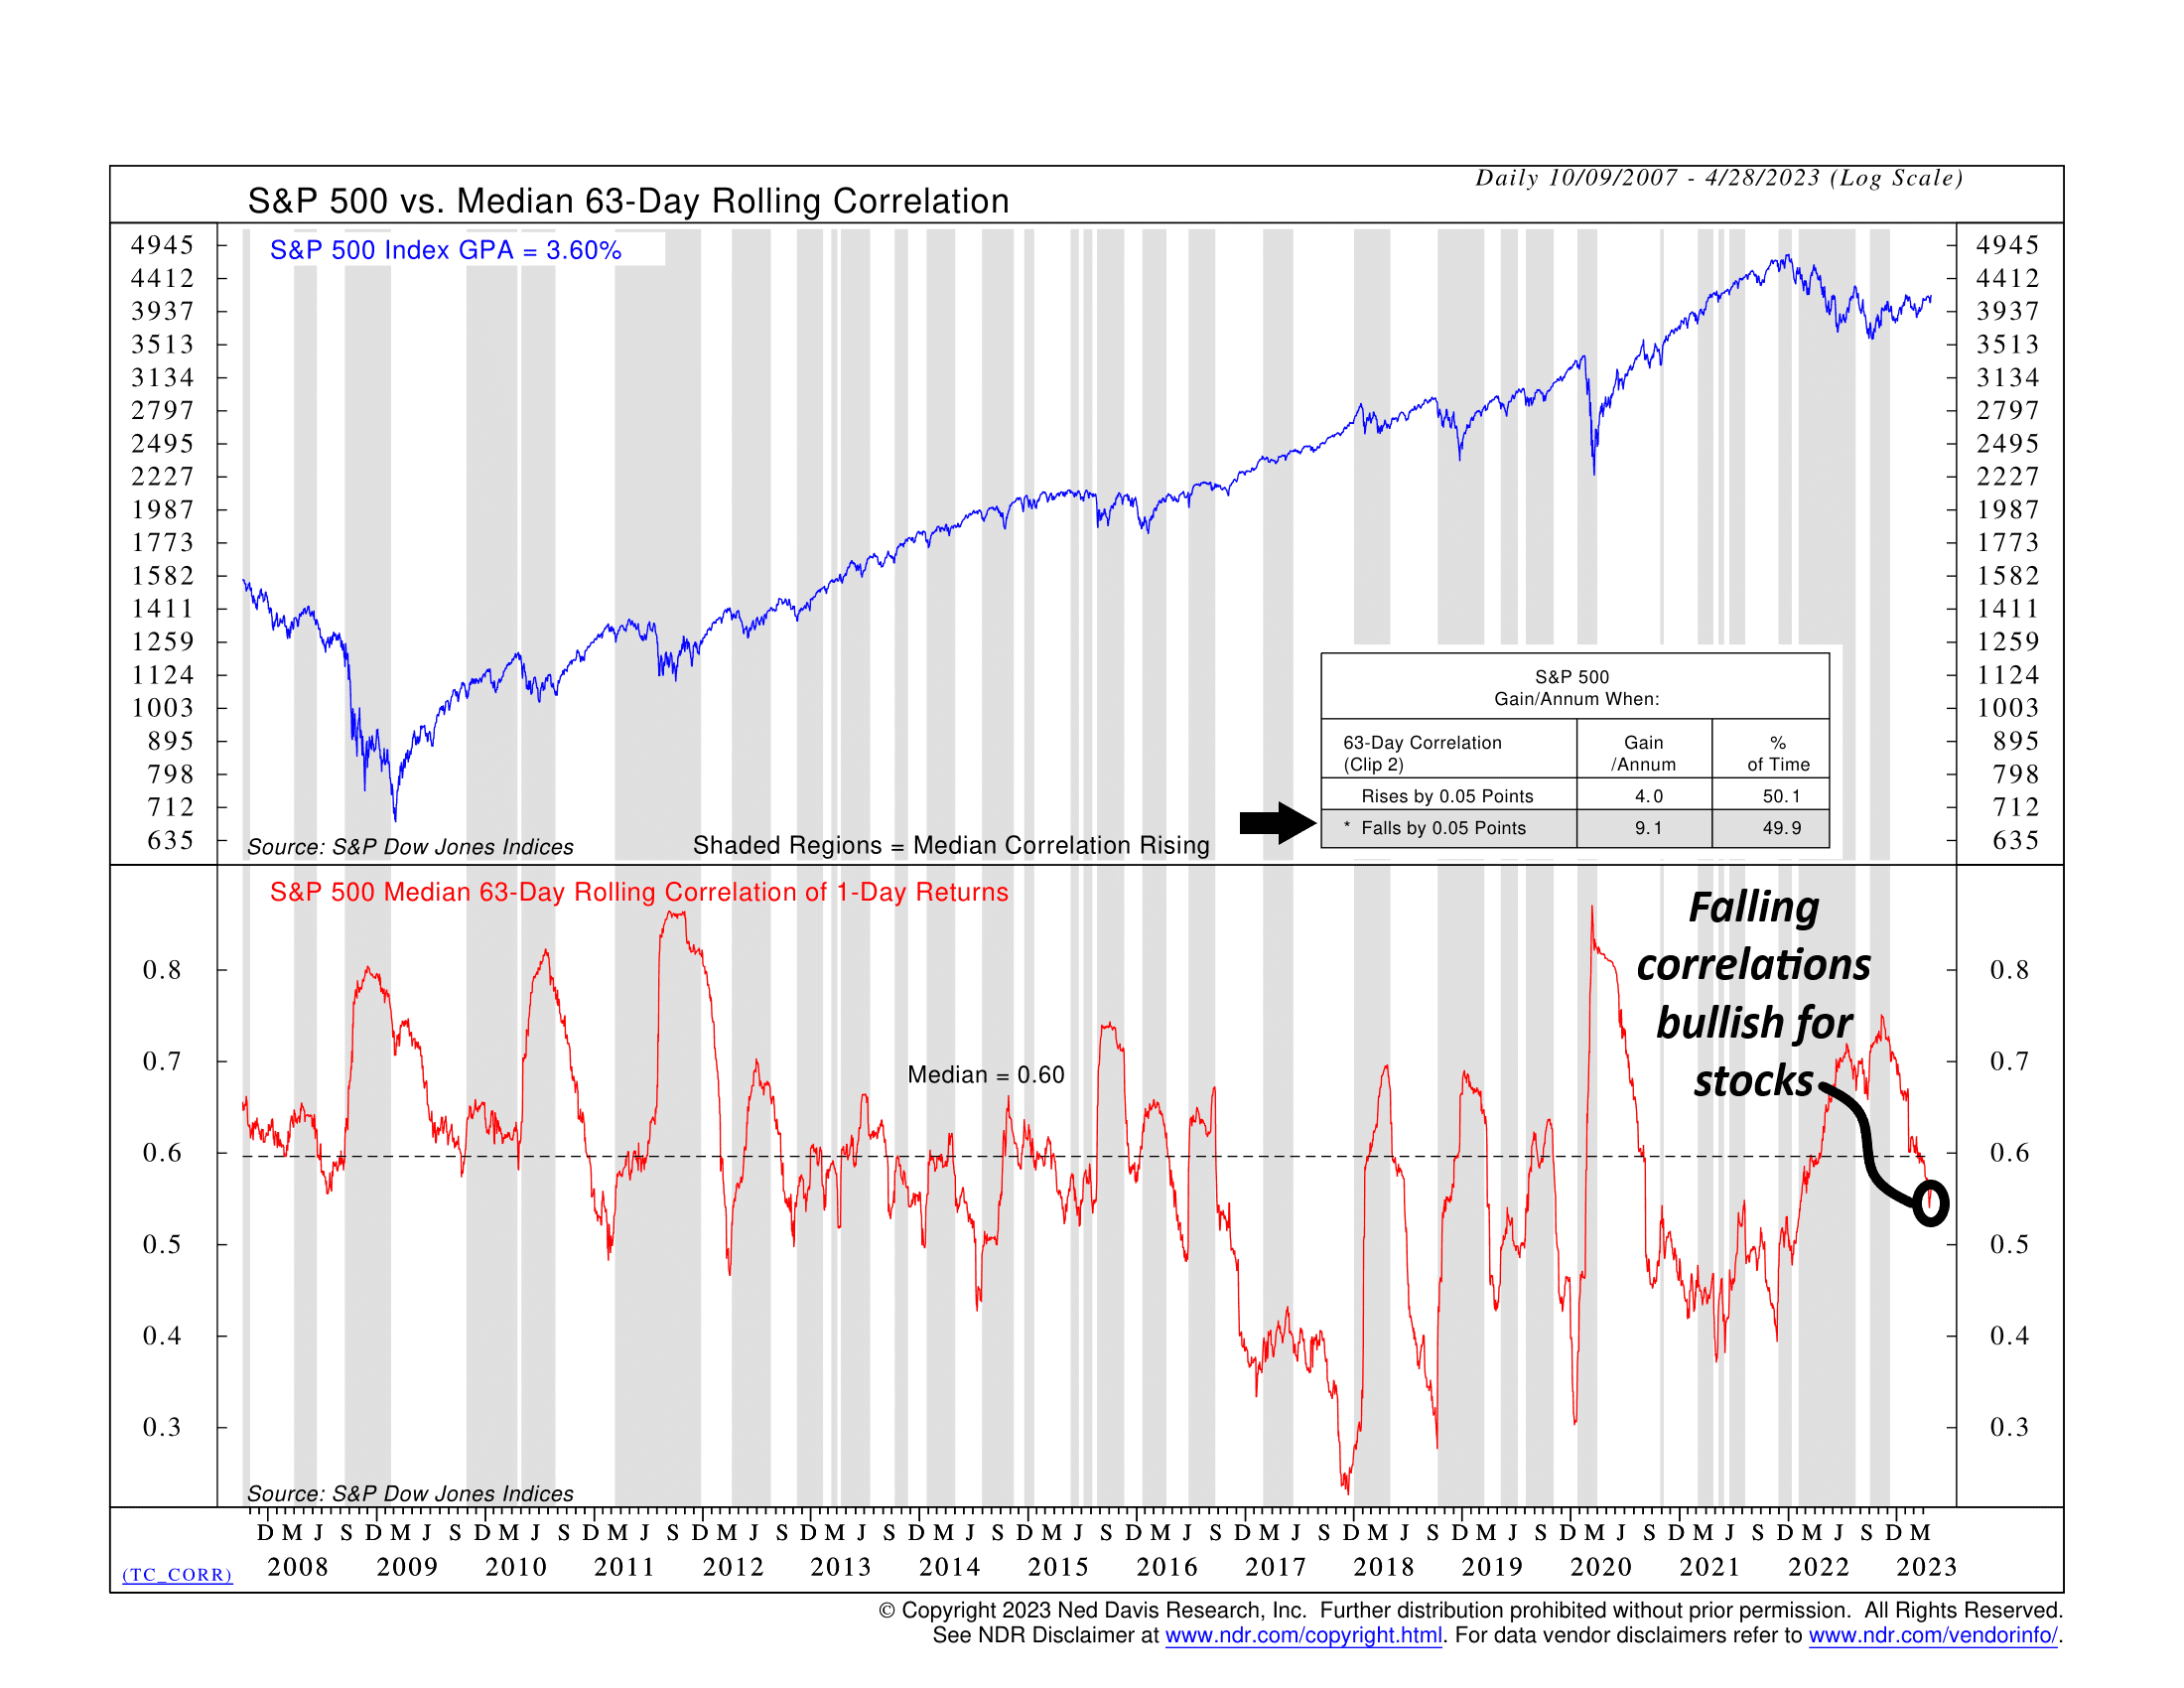
As the chart above shows, the 63-day realized correlation among S&P 500 shares has continued to fall this year and is currently below the historical average. A correlation indicator like this one can be viewed as a gauge of investor sentiment, so the fact that correlations are falling from last year’s elevated levels is a bullish sign for stocks.
Speaking of sentiment, another piece of data released recently showed that the share of investors who invest in stocks compared to bonds is at its lowest level since 2009.
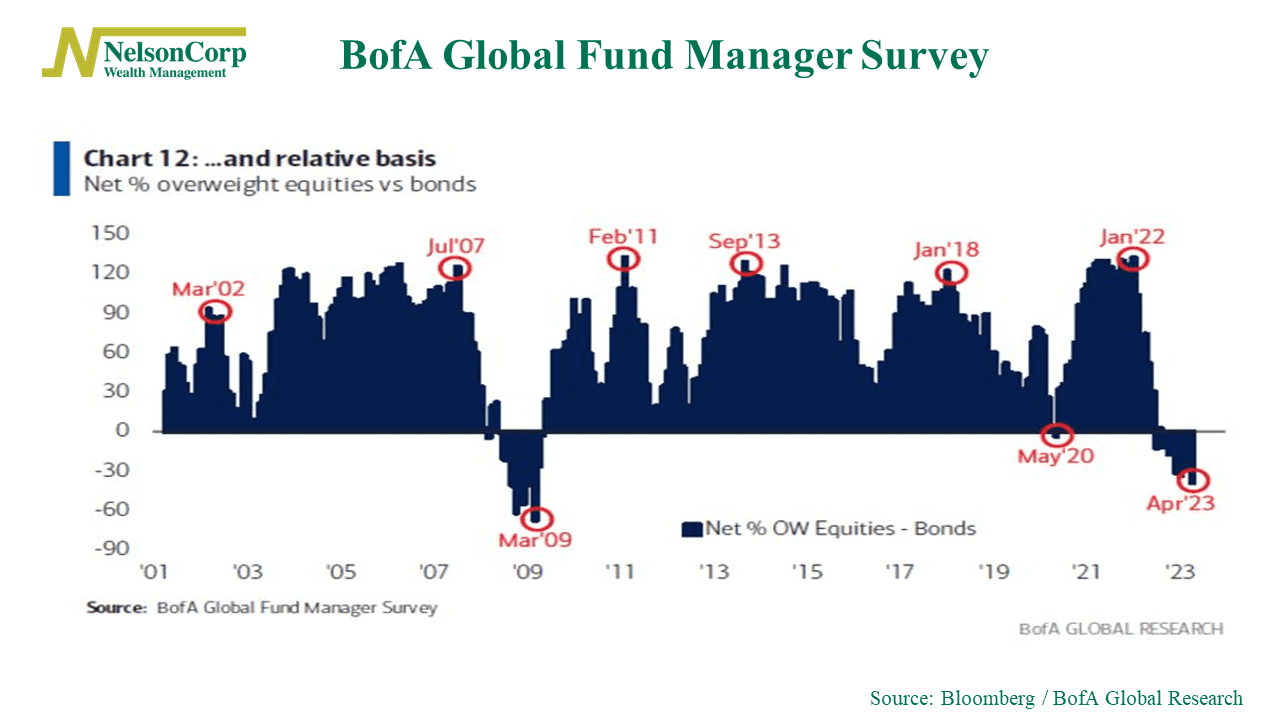
This BofA Global Fund Manager Survey, shown above, reveals that investors drove their bond allocation to a net 10% overweight relative to stocks last month.
But the thing is, as we talked about last week, investors tend to be wrong when they’re all going in the same direction. Just look at the last time the survey was as bearish as it is today. March 2009? That turned out to be a pretty good time to own stocks.
So, the bottom line is that despite the recent sideways price action in the market, there are some reasons to be moderately bullish. Of course, the market will eventually make its move—either up or down—but for right now, the weight of the indicator evidence is mostly neutral—with maybe a slight bullish bias.
This is intended for informational purposes only and should not be used as the primary basis for an investment decision. Consult an advisor for your personal situation.
Indices mentioned are unmanaged, do not incur fees, and cannot be invested into directly.
Past performance does not guarantee future results.