OVERVIEW
The U.S. stock market took a step backward last week, with all three major averages falling. The S&P 500 dipped 0.26%, the Dow dropped 0.93%, and the Nasdaq brought up the rear, slipping 1.17%.
Among different types of stocks, growth fell by 1.19%, while value stocks went up by 1.07% for the week. Large-cap stocks (big companies) were down by 0.65%, and small-cap stocks (smaller companies) dropped slightly by 0.03%, but mid-cap shares (medium-sized companies) saw a nice gain of 1.43%.
Foreign stocks did better overall. Stocks from developed countries surged by 2.34%, and emerging markets increased by 1.21%.
Bond prices went up because bond yields dropped. For example, the 10-year Treasury yield fell to 4.08% from 4.19% the week before. This helped push up the prices of intermediate-term Treasuries by 0.63% and long-term Treasuries by 1.37%. Investment-grade bonds gained by 0.87%.
Commodities had a good week, too. Overall, commodity prices went up by about 0.8%, led by a big jump in gold prices of about 4.68%. Real estate also did well, increasing by 1.34%. To cap it off, the U.S. dollar weakened by about 0.9%.
KEY CONSIDERATIONS
It’s Good to Be Average – They say you shouldn’t settle for average. But when it comes to bull markets, we say it’s good to be average.
Let me explain. Since the low point in October 2022, the S&P 500 stock index has risen by about 45%.
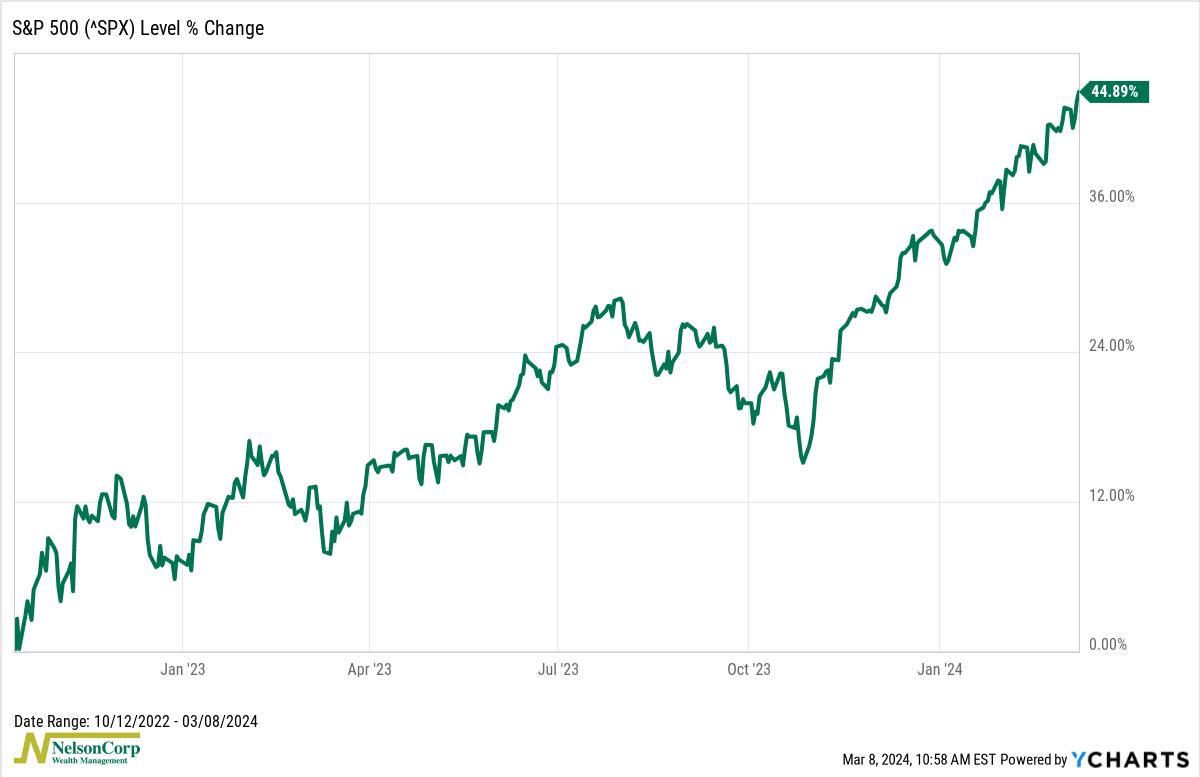
How does that compare to the typical cyclical bull market since 1928? Well, after 17 months, it’s right in line with the average, which is represented as the blue line in the chart below.
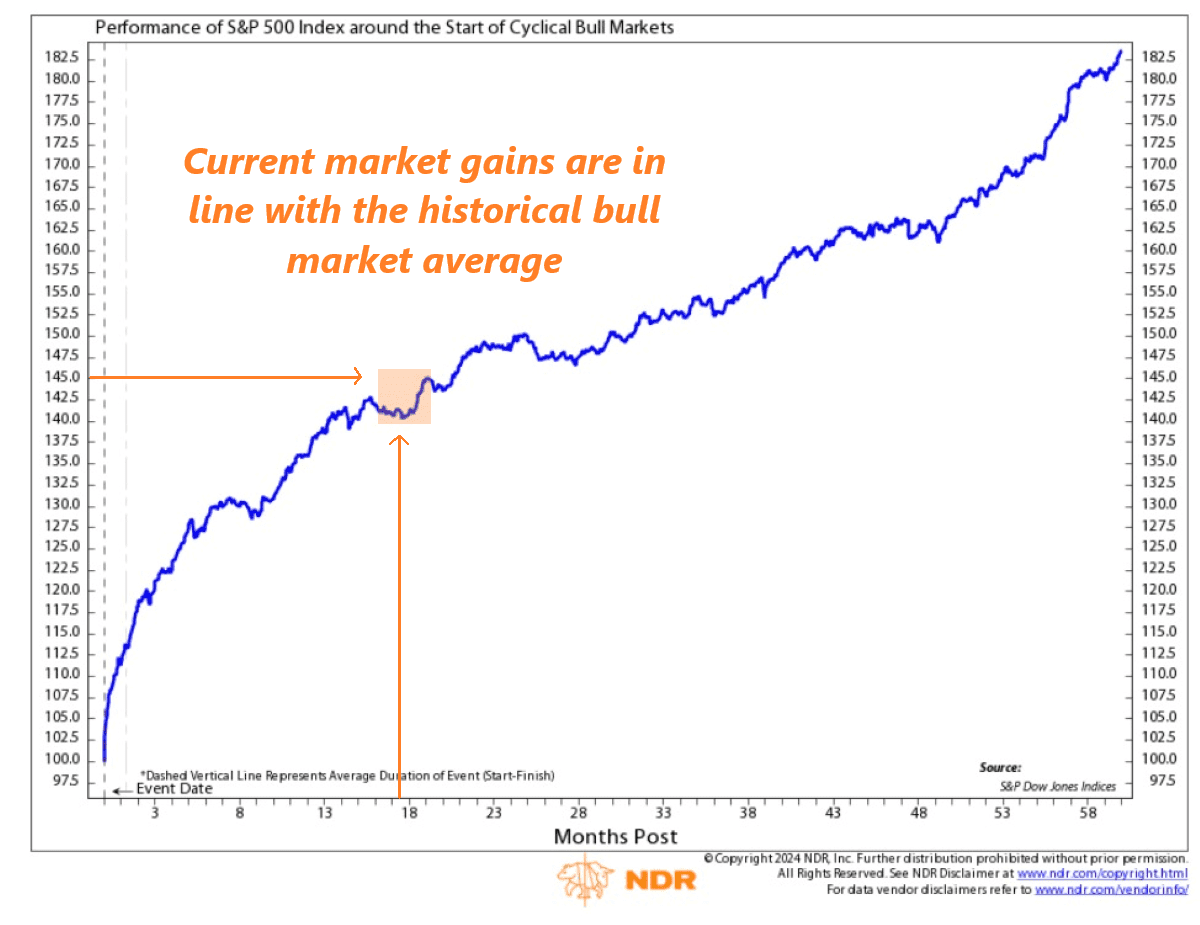
But it hasn’t been smooth sailing all along. Five months into the new bull market, the S&P 500 was trailing the average by 16 percentage points. Even just two months ago, at the 15-month mark, it was still below the average by nearly 7 percentage points.
So, in our opinion, the fact that the S&P 500 has now caught up to the typical bull market pace after a slow start is probably a good thing.
Will it keep going? The evidence suggests there’s a good chance it will. However, there are some reasons to be cautious.
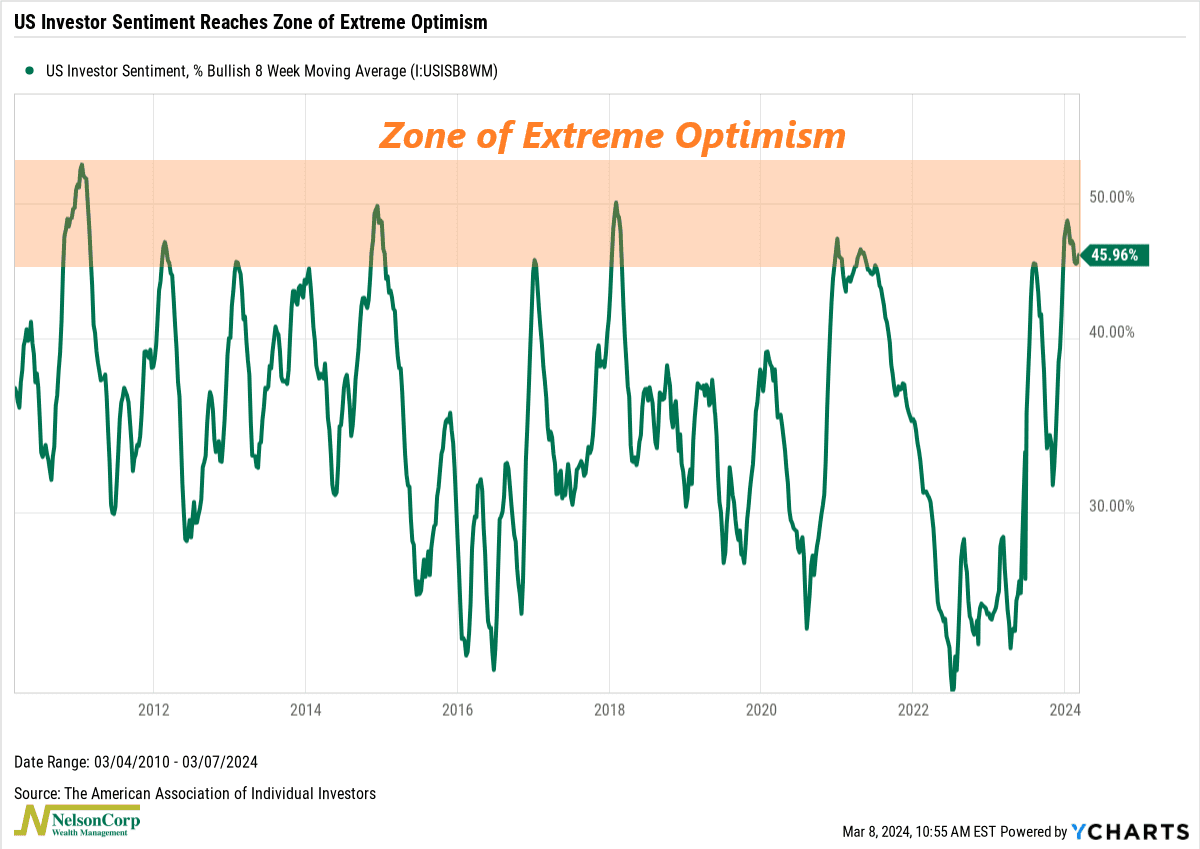
For instance, investor sentiment seems to be reaching extreme levels of optimism, as indicated by the chart below showing the 8-week moving average of bullish market sentiment. While you need bullish investors for a bull market, history shows that when sentiment gets too extreme, it can be a warning sign for stocks.
Moreover, the strength of the market itself could become a headwind. As this final chart shows, the S&P 500 Index is up more than 8% to start the year.
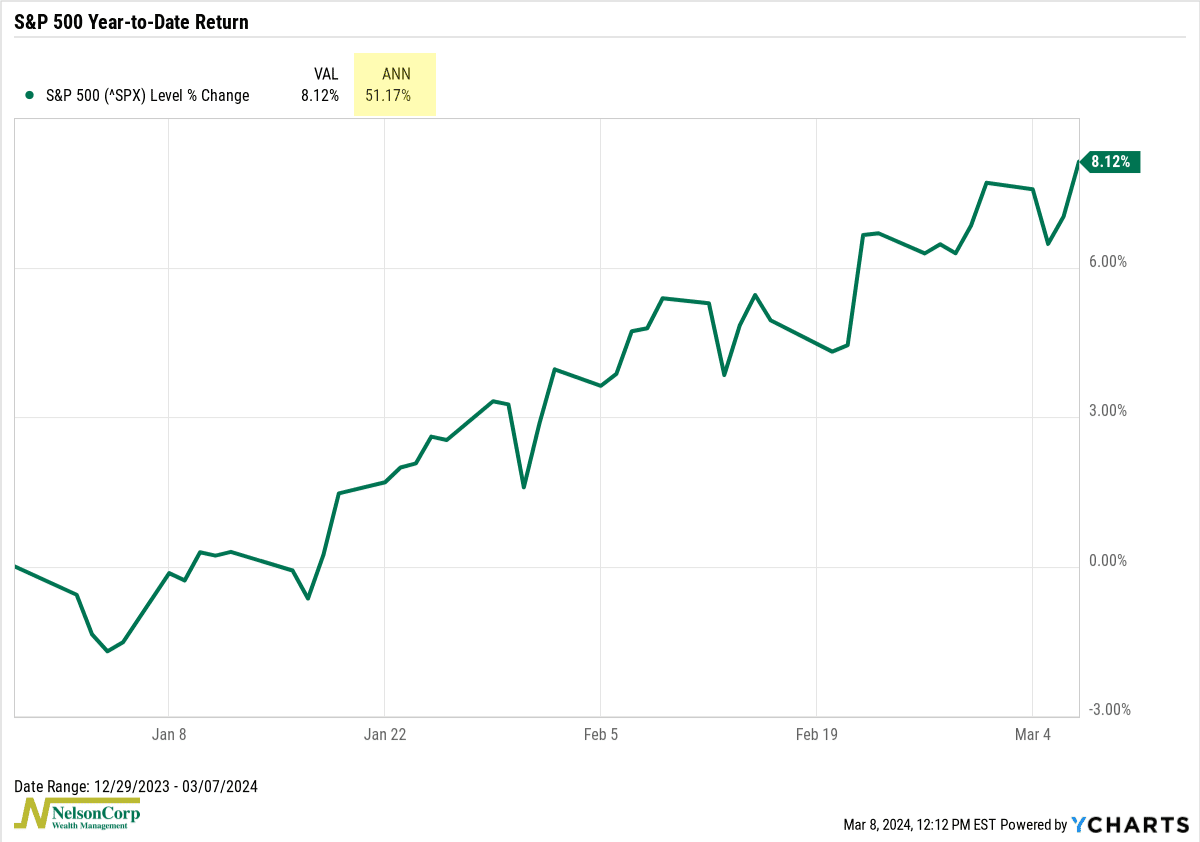
That annualizes to a more than 50% gain for the year (highlighted in yellow). If that were actually to happen, it would be the largest annual calendar gain on record for the S&P 500. While we’re not ruling out that possibility, it’s more likely than not that the pace of gains will slow down as the year progresses.
So, the bottom line is that the stock market’s rapid pace of gains over the past few months has actually brought the current bull market up to its historical average for a new bull market—and that’s likely a good thing. We could start to see gains slow down going forward, given extreme levels of optimism among investors, but for the most part, overall prospects for the stock market remain positive.
This is intended for informational purposes only and should not be used as the primary basis for an investment decision. Consult an advisor for your personal situation.
Indices mentioned are unmanaged, do not incur fees, and cannot be invested into directly.
Past performance does not guarantee future results.
The S&P 500 Index, or Standard & Poor’s 500 Index, is a market-capitalization-weighted index of 500 leading publicly traded companies in the U.S