OVERVIEW
Another volatile week left U.S. stocks deeper in negative territory for the year. The S&P 500 fell 1.27%, the Dow dropped 1.3%, and the NASDAQ tumbled 2.78%.
Growth stocks declined 2.56%, compared to a 0.45% drop for value stocks. Small-caps fell 0.89%, and large-caps declined 1.55%.
International stocks had a rough week, as well. Developed country stocks plummeted 6.53%, and emerging markets dropped around 2.3%.
With investors in risk-off mode, they poured into the safety of U.S. Treasuries. Intermediate-term Treasuries rose 1.32%, and long-dated Treasuries gained around 2.85% for the week.
Investment-grade corporate bonds also did well, gaining 0.83%. High-yield (junk) bonds, however, dropped around 0.16%. Municipals were up about six basis points, and inflation-protected Treasuries (TIPS) surged ahead by about 2.3%.
Of course, given the war between Ukraine and Russia, the biggest gains of the week came from commodities, as the more than 20% surge in oil prices resulted in a broad-based commodity index gain of around 13%. Corn rose upwards of 14%, and gold prices rallied around 4.3%.
All this despite a 2% gain in the value of the U.S. dollar, which also tends to see big inflows during risky geopolitical events.
KEY CONSIDERATIONS
Mind the (Sentiment) Gap – Investor sentiment, when it gets extreme, tends to be wrong.
Markets may change, but human behavior stays the same.
We’ve found these sayings to be generally true about the stock market.
So, one of the core factors that goes into our modeling process has to do with looking at investor sentiment and determining when it has gotten too extreme—at which point we lean in the other direction to take advantage of a one-sided market.
To measure investor sentiment, we split our sentiment indicators into two separate categories: surveys/polls and investor positioning.
The surveys and polls component can be thought of as what investors say about how they feel about the stock market.
By contrast, investor positioning is how they are actually investing or positioning their money.
They don’t always agree.
Take this year, for example. Below is the output of the Surveys/Polls Composite that goes into our intermediate-term stock market risk model. It combines six different survey-based indicators into one composite and spits out a reading between 0 and 100. Readings above 60 are considered positive for the model. And since we look at sentiment in a contrary manner, that means the majority of the indicators are saying investors are pessimistic about the stock market.
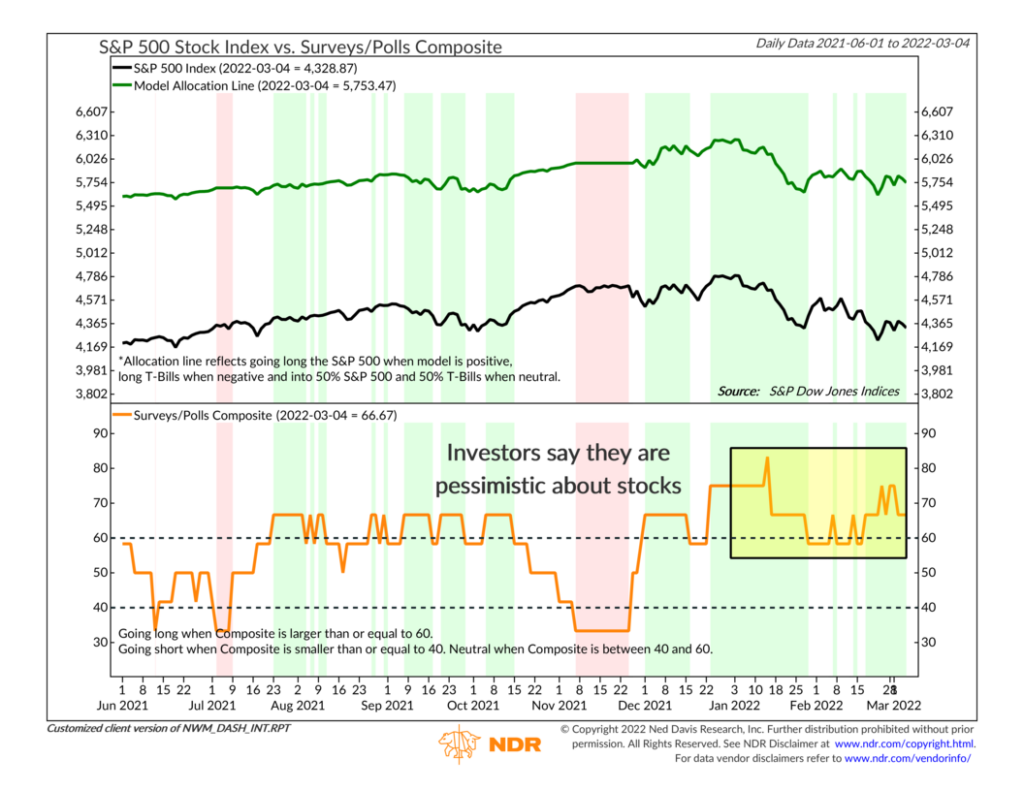
I’ve highlighted the composite’s reading for 2022. And as you can see, it’s been mostly positive all year. In other words, investors are saying they don’t feel too good about stocks right now.
Usually, that’s a bullish signal from our model’s viewpoint.
However, here’s the reading from the Investor Positioning Composite, which also combines six different sentiment indicators but uses ones based on how investors are actually allocating their money.
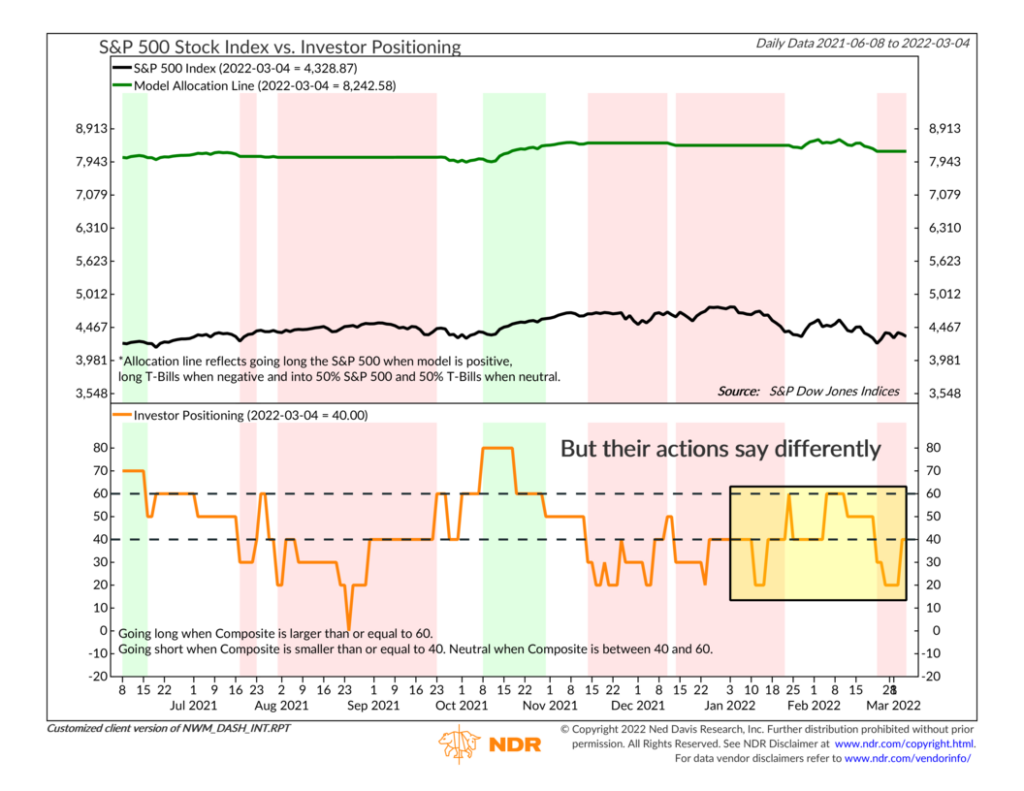
The story here is different. The composite has been either neutral or negative all year. It reached a high neutral for a few days near the beginning of February but has since plummeted to lower levels.
Again, a negative reading from this composite means investors have positioned themselves as if they are bullish about the stock market. This is in stark contrast to what they are saying about how they feel about stocks, as evidenced by the opposite reading from the Surveys/Polls Composite.
When the market sells off as it has in recent months, it’s the investor behavior component of our model that tends to improve first. This is because market sentiment plummets as investors get gloomy about the future, and this negative sentiment feeds back into our sentiment-based indicators as a positive signal.
However, the “sentiment gap” between our two sentiment composites is holding our overall model back from getting too bullish at the moment.
To be sure, we’ve seen some improvement in these areas, and our overall model is moving in a more positive direction.
But, at least as far as investor sentiment is concerned, we’ll be looking for the gap between what investors are doing and what they are saying to close further before we can get more confident that the stock market has bottomed.
This is intended for informational purposes only and should not be used as the primary basis for an investment decision. Consult an advisor for your personal situation.
Indices mentioned are unmanaged, do not incur fees, and cannot be invested into directly.
Past performance does not guarantee future results.