OVERVIEW
The tech-heavy Nasdaq Composite had another monster week, gaining over four percent for the second consecutive week.
The S&P 500 index and the Dow Jones Industrial Average did less well but were still up 1.76 percent and 0.96 percent, respectfully.
Emerging market stocks have had a nice little run lately, gaining over seven percent in the past two weeks.
By comparison, developed country stocks are up about 1.85 percent over that same period.
Bond yields dropped last week, resulting in strong gains for long-term Treasuries and investment-grade bonds.
Real estate, however, had a miserable week, dropping more than three percent.
Commodities rose for the week, propped up by the strong returns from gold.
And finally, the U.S. dollar weakened for the third straight week, down about 0.7 percent.
KEY CONSIDERATIONS
Only Dead Fish Go With the Flow – The flow of money into and out of the stock market has a significant impact on its performance. However, the effect tends to be in the opposite direction of what many people think.
Over the past 20+ years, the S&P 500 index has logged all of its net gains when equity fund flows (mutual funds and ETFs) have seen outflows over the prior four weeks.
Stated differently, when more money flows out of rather than into equity funds, stocks tend to perform the best!
This might be counterintuitive. But in reality, it’s how one should think about sentiment in the stock market.
It generally pays to go with the crowd until sentiment extremes are hit, and then you take a contrarian position and lean back against the group.
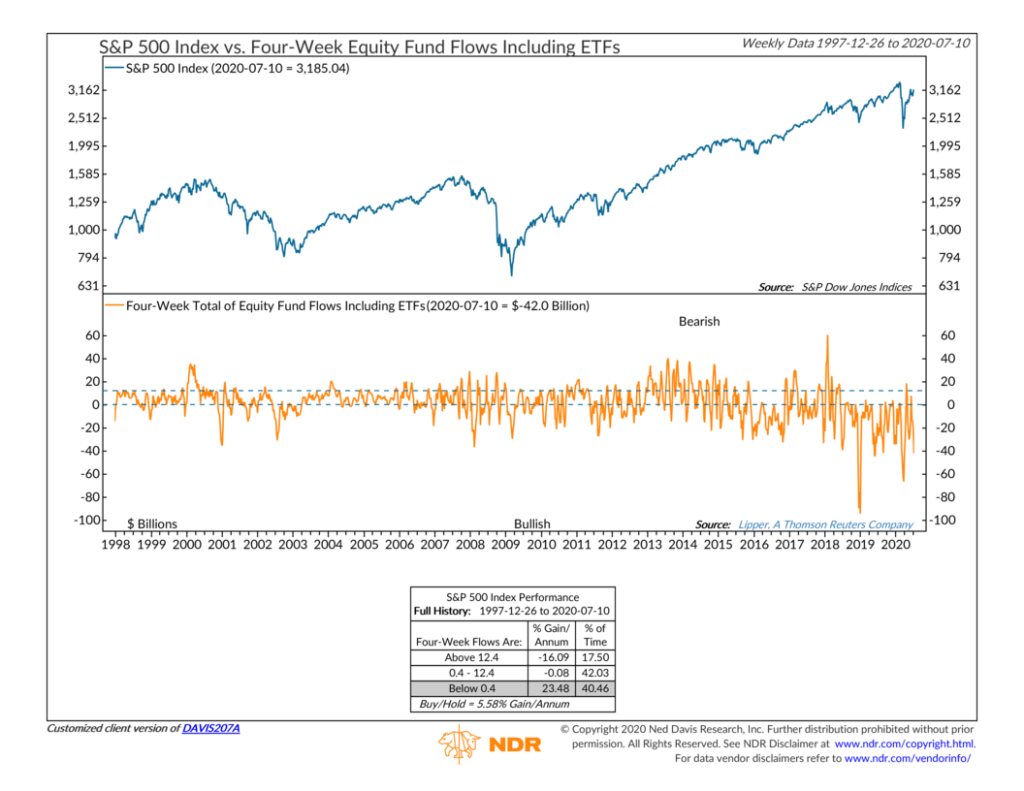
Last week, equity fund outflows reached over $42 billion over the past four weeks. Historically, this has been an excellent buying opportunity for stocks.
And, as stated above, all of the stock market’s net gains have come when net money flows are negative for equity funds.
Too Much Optimism Elsewhere? – Where we might be seeing too much optimism, however, is the tech-heavy Nasdaq Composite.
Over the past three months, the Nasdaq has gained roughly 27 percent! By comparison, the S&P 500 is up about 13 percent.
To measure sentiment, we look at the Hulbert Newsletter Nasdaq Sentiment Index. This index measures the average stock exposure among advisors who focus on timing the Nasdaq’s shorter-term movements.
As of last week’s reading, the index is about 77 percent. Historically, this has signified an overbought level (extreme optimism), and returns tend to be worse than average with confidence this high.
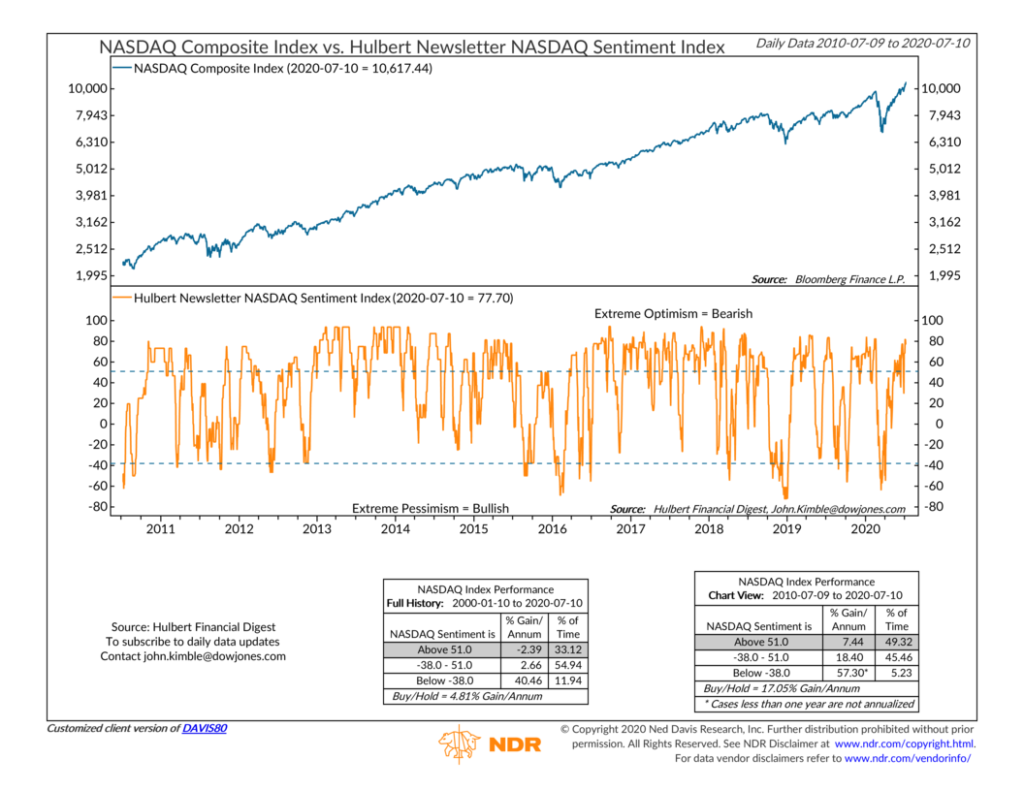
I would note, though, that over the past ten years the index has been at levels of extreme optimism nearly 50 percent of the time and still returned, on average, about 7.44 percent per year.
However, this is still less than half the gain (more than 18 percent) that the Nasdaq returns when the index is at more moderate levels of sentiment.
All in all, we’d say that sentiment appears to be more or less reasonable for the S&P 500 index, and perhaps stretched for the more tech-focused Nasdaq Composite.
This is intended for informational purposes only and should not be used as the primary basis for an investment decision. Consult an advisor for your personal situation.
Indices mentioned are unmanaged, do not incur fees, and cannot be invested into directly.
Past performance does not guarantee future results.