OVERVIEW
U.S. stocks faltered last week, with all three major indices closing in the red. The S&P 500 fell 0.95%, the Nasdaq dropped 0.8%, and the Dow brought up the rear, ending down 2.3%.
Value stocks underperformed, falling 1.4% versus the 0.8% loss for growth stocks. As for size, large caps outperformed, falling just 0.8% compared to the 2.68% decline in small caps.
Foreign markets were mixed. Although developed country stocks fell 1.36%, emerging markets saw gains of 0.24%.
Bond prices fell as the benchmark 10-year yield rose to 4.4% last week. Intermediate-term Treasuries dropped about 1%, and long-dated Treasuries plunged more than 3%.
Commodities had a strong week, with prices rising about 3.4%. This was largely driven by a 4.66% increase in oil prices. Gold also performed well, gaining about 4.8% for the week. However, real estate saw a significant drop of nearly 3%. The U.S. dollar also experienced a slight dip of 0.11%.
KEY CONSIDERATIONS
Riding the Bull – There’s this saying on Wall Street that goes something like, “A bull market is a bull. It tries to throw off its riders.”
In other words, during a bull market, there’s going to be some bumps along the way. Sellers get nervous and start to sell their shares. Occasionally, we get a correction (a 10%+ decline). That happens about once every 1-2 years.
Last week, we might have seen a few early signs of the bull market trying to throw off some riders.
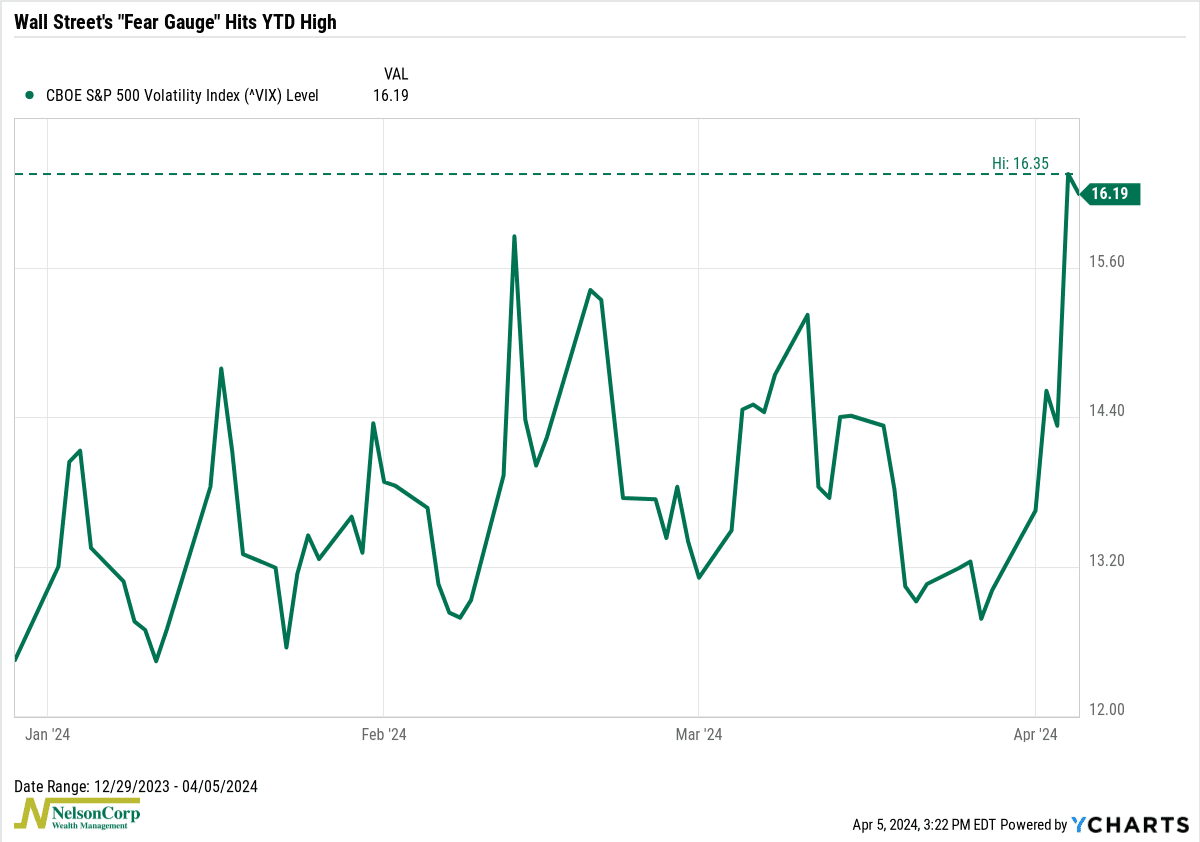
For one, the VIX Index—a measure of expected stock market volatility—jumped to around 16 at one point, its highest level of the year. While still low by historical standards, this indicates slightly elevated fear among investors.
As for stocks, this next chart shows that breadth has weakened in the near term for many of the major U.S. stock market indices. As of last Friday, less than half of the stocks were trading above their average 30-day price.
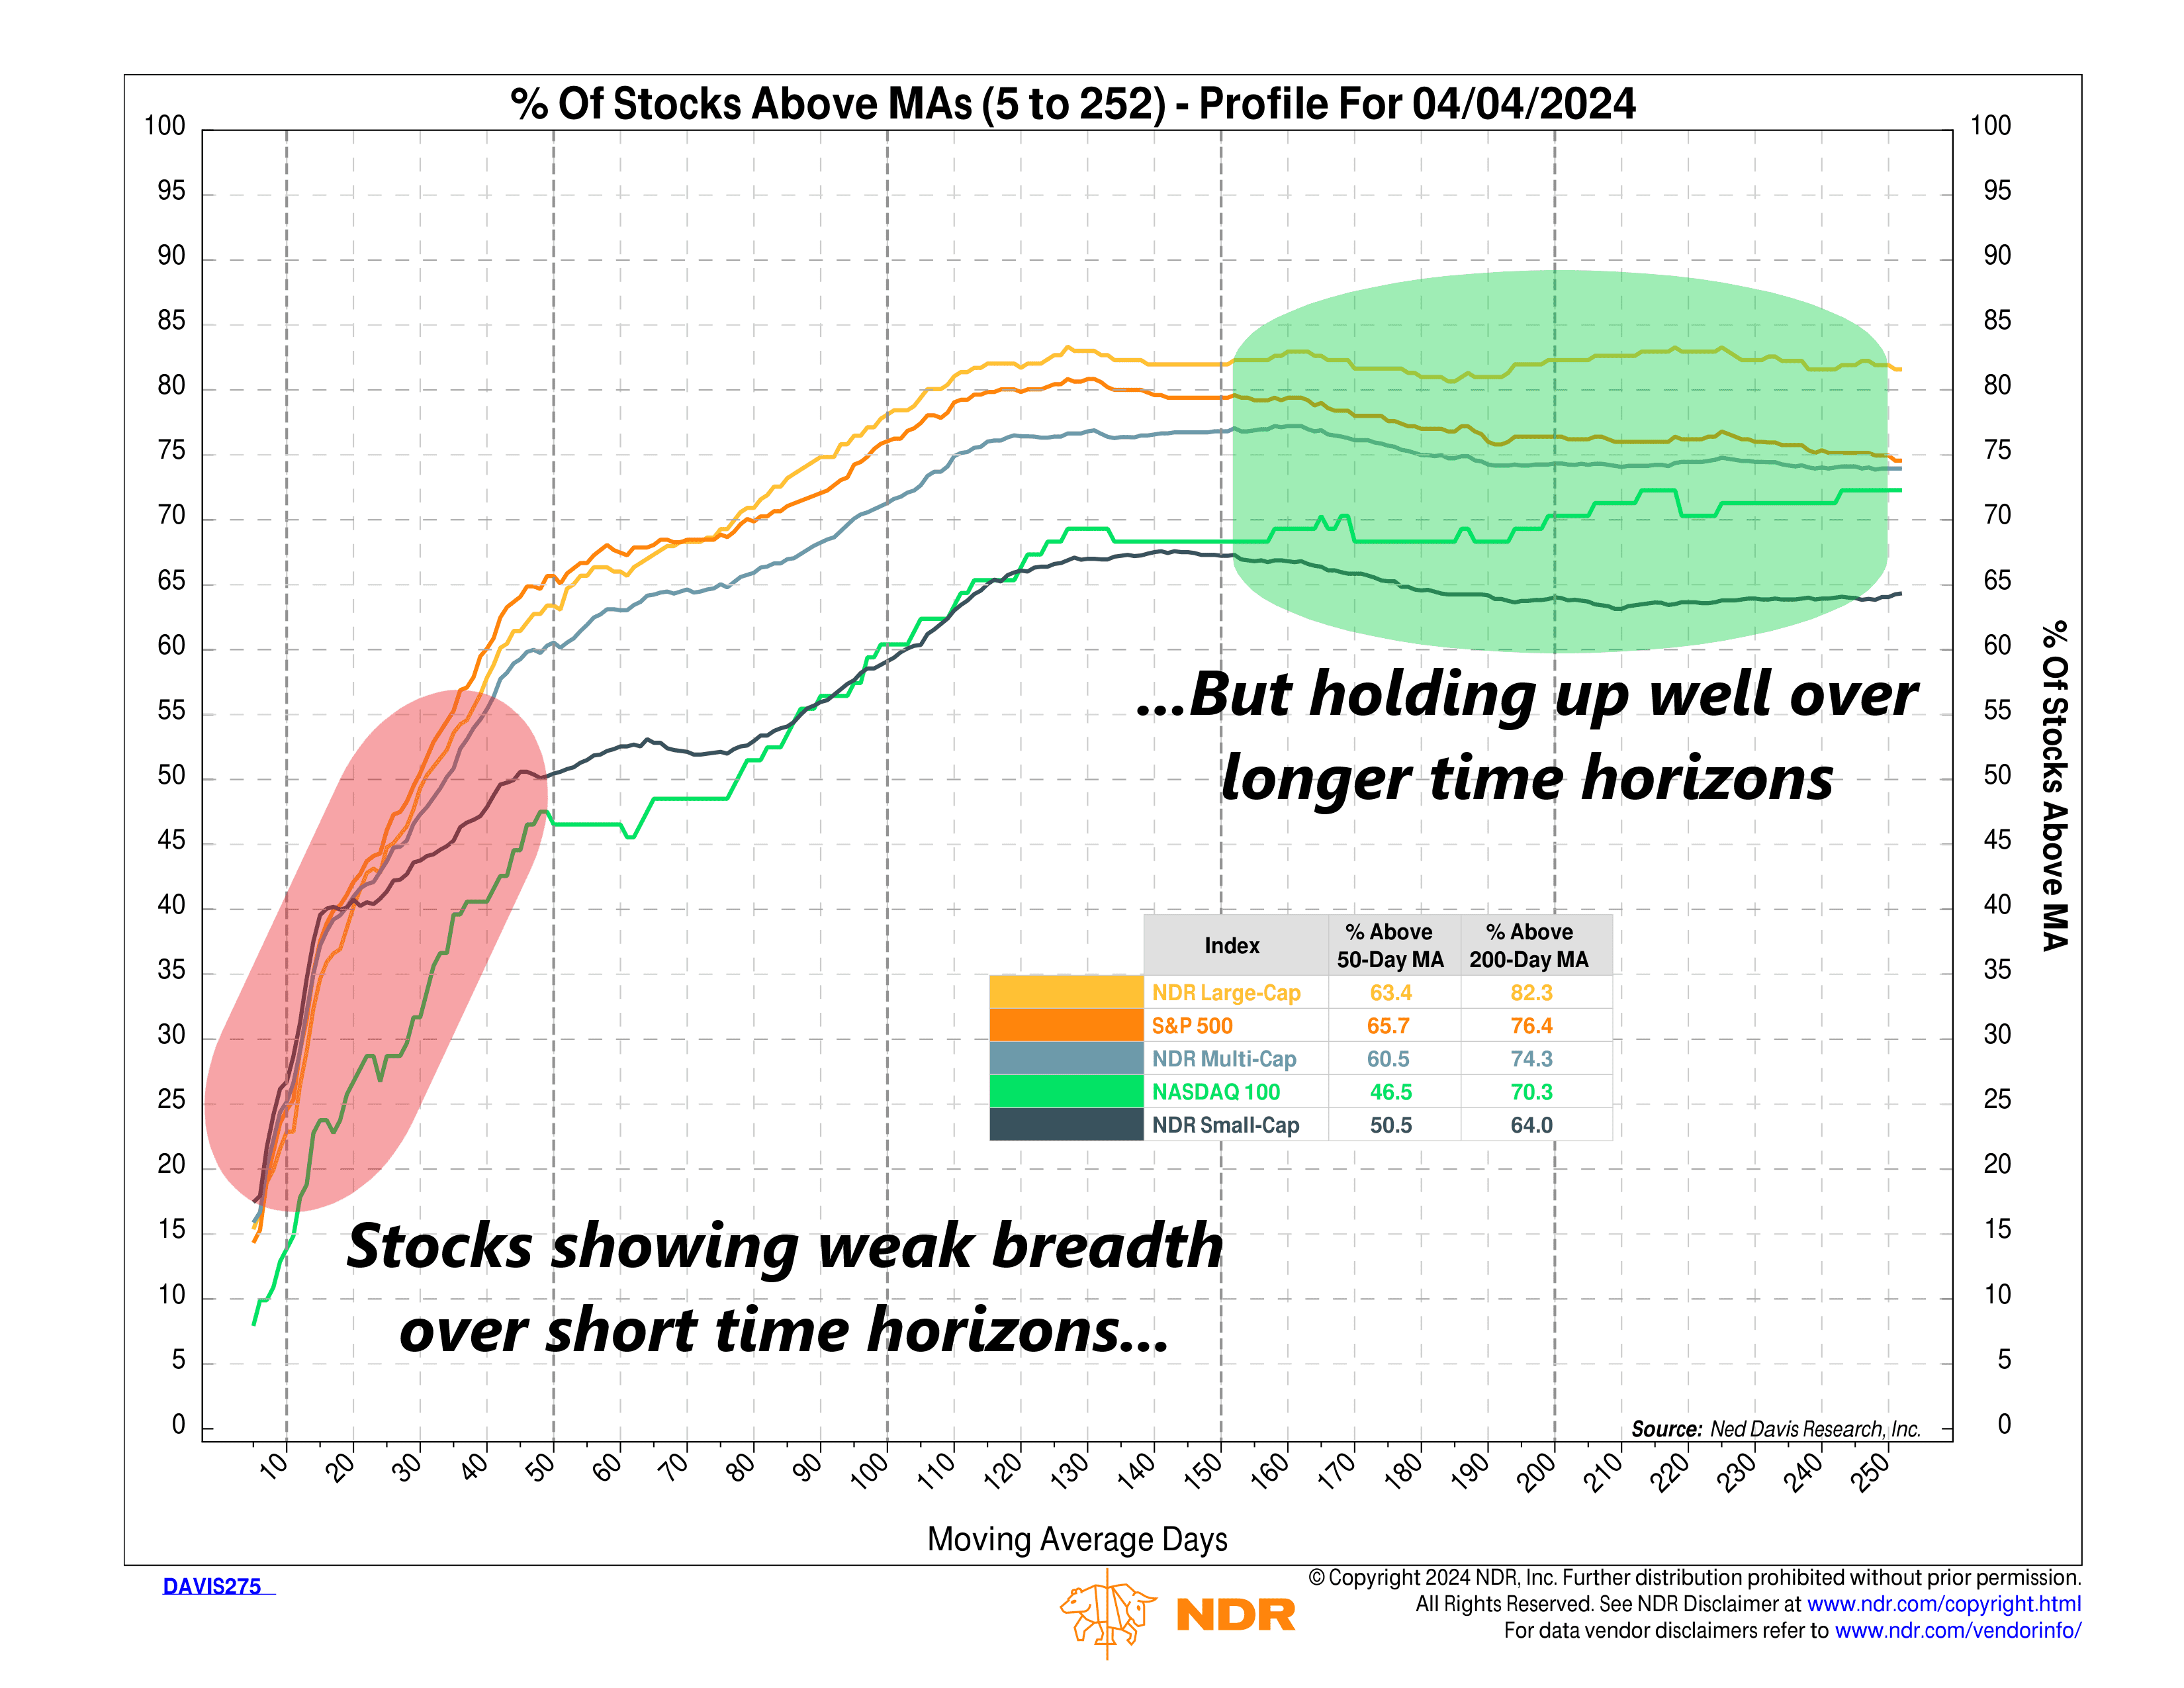
Those are the riders getting thrown off the bull.
But here’s the good news: if we stretch the time horizon out a bit, breadth still looks pretty good. As you can see on the chart above, no less than 60% of the stocks in the major U.S. indices are trading above their average 200-day price. For the S&P 500, that percentage is more than 75%.
In other words, over the long haul, the stock market’s breadth—the number of stocks participating in the market’s movements—is holding up well.
However, it’s important to keep an eye on this. It could signal trouble ahead if we start to see a decline in the intermediate- and long-term time frames. At that point, we’ll need to carefully weigh all the evidence to decide if riding the bull is still prudent.
This is intended for informational purposes only and should not be used as the primary basis for an investment decision. Consult an advisor for your personal situation.
Indices mentioned are unmanaged, do not incur fees, and cannot be invested into directly.
Past performance does not guarantee future results.
The S&P 500 Index, or Standard & Poor’s 500 Index, is a market-capitalization-weighted index of 500 leading publicly traded companies in the U.S