OVERVIEW
After a tumultuous few weeks of trading, stocks around the globe switched to rally mode last week.
The MSCI All Country World Index, a measure of global stocks, rose 9.94 percent.
The S&P 500 Index, which tracks the 500 largest companies in the United States, rose by more than ten percent.
The VIX Index, a measure of volatility, receded from its recent all-time high reading of nearly 83; however, at around 60, it is still elevated relative to its historical average.
Bonds also rallied as the 10-Year U.S. Treasury Note yield fell from 0.85 percent to start the week to 0.68 percent by Friday’s close.
Even the Bloomberg Commodity Index rallied a few percentage points.
However, this was mainly due to the surge in gold prices–commodities as a whole remain in a long-term downtrend.
KEY CONSIDERATIONS
Showing Signs of Life – By historical standards, this stock market decline has been fast and furious.
A little over a month ago, the S&P 500 index reached an all-time high. By last Monday, it had fallen nearly 34 percent.
This sudden and unexpected fall in asset prices anticipated the abrupt shutdown of the economy caused by the coronavirus and the fall in oil prices.
The effects on the real economy are becoming more apparent every day.
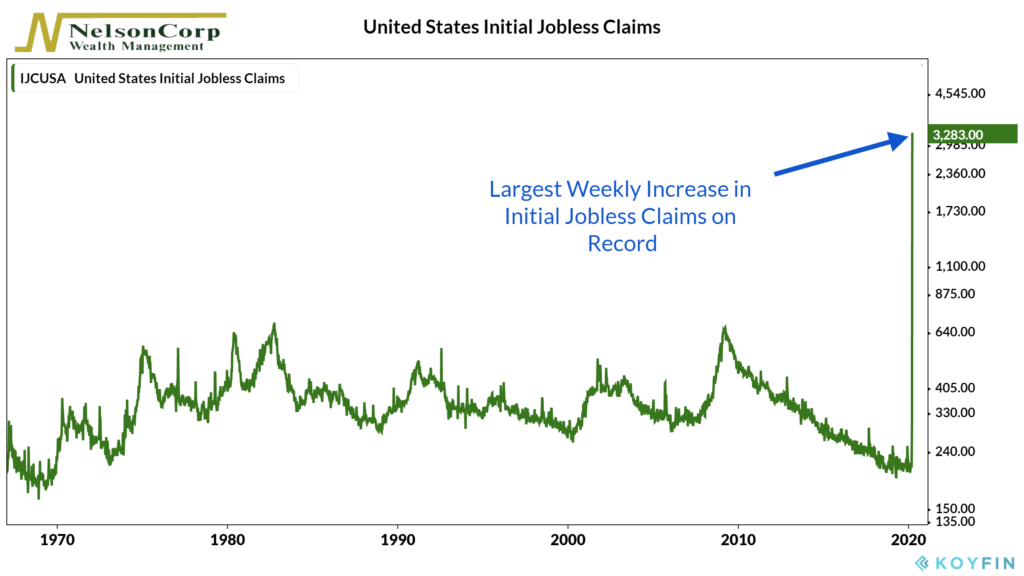
Last week, initial jobless claims in the United States skyrocketed to 3.283 million, by far the largest weekly increase on record–and it’s not even close!
As people self-isolate and stay home, they are saving more and spending less.
And surveys show that their general enthusiasm for spending has declined. On Friday, the Reuters/University of Michigan Consumer Sentiment Index fell nearly 12 percent in the preliminary March survey, its biggest decline since October 2008.
The stock market, however, did show some signs of life last week.
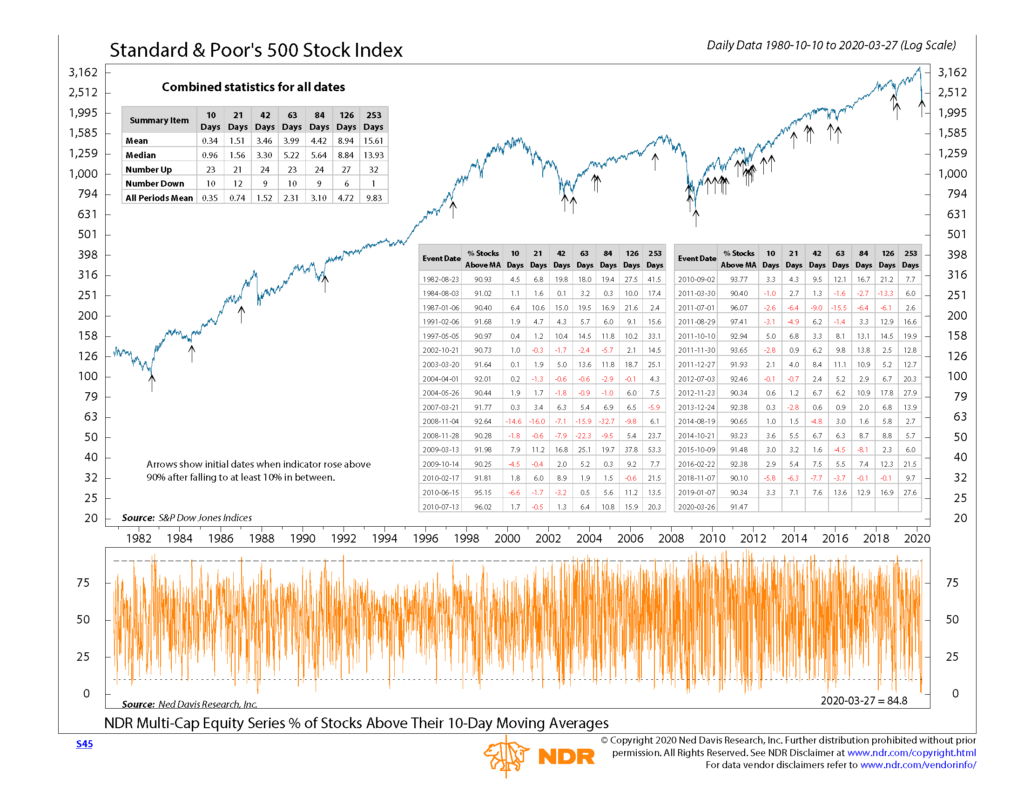
It showed up in one of the measures we track, which is referred to as a breadth thrust (something that shows strong and broad-based participation in an upside stock rally).
This indicator gives us a “buy” signal once 90 percent or more of stocks have begun trading above their 10-day average price after falling to 10 percent or less beforehand.
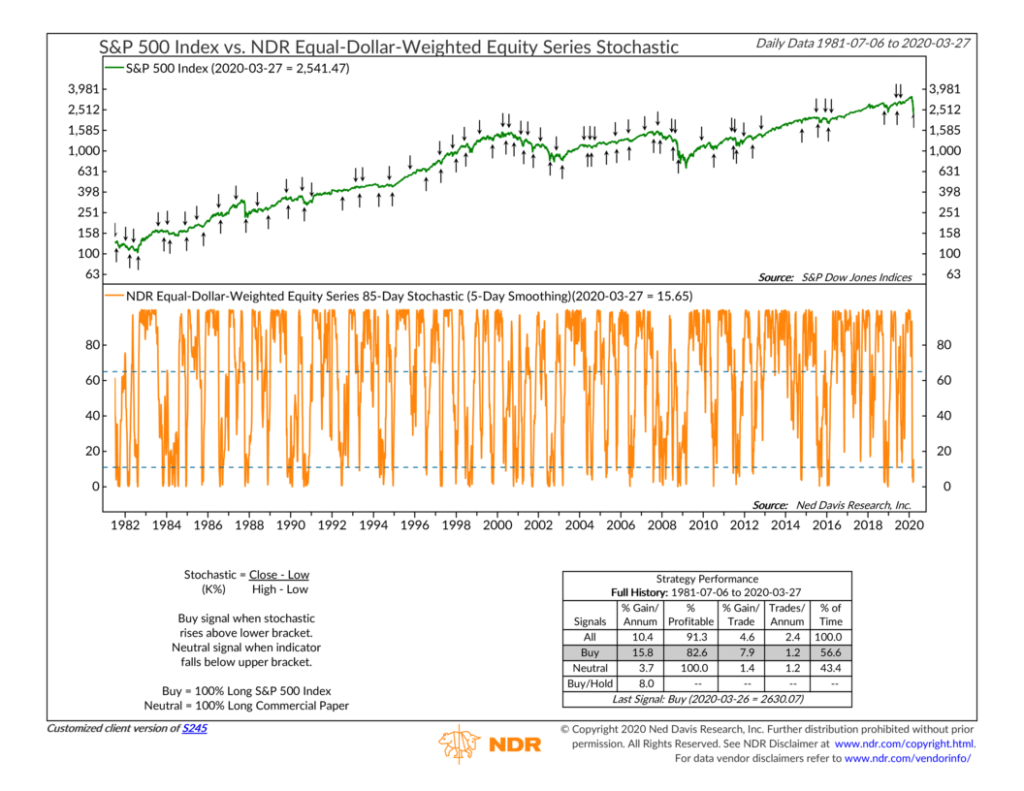
And it showed up in another type of indicator that measures stock market momentum. This one looks at whether stocks are closing near the top or the bottom of their 85-day price range. It revealed they had been closing near their bottom range since the end of February, but that last week they reversed course and are now moving upwards.
I should caution, however, that these are just two positive signals out of a sea of indicators that still suggest the risk to stocks remains elevated, at least over the intermediate-term.
To paraphrase Aristotle, two positive signs do not a bullish signal make.
But it is a start. And if we get more signals like these, it would build a more durable case for adding more exposure to riskier assets.
This is intended for informational purposes only and should not be used as the primary basis for an investment decision. Consult an advisor for your personal situation.
Indices mentioned are unmanaged, do not incur fees, and cannot be invested into directly.
Past performance does not guarantee future results.