OVERVIEW
U.S. stocks took another step backward last week, with the S&P 500 dropping 0.64 percent, its third straight week in the red.
The Nasdaq had a similar decline of 0.56 percent. The Dow, however, remained mostly flat for the week, dropping just 0.03 percent.
Volatility drifted lower despite the continued sell-off in U.S. stocks. The VIX, while still elevated, settled at a level just under 26.
International stocks did quite well in comparison. Developed country stocks rose 0.78 percent while emerging market stocks saw a solid gain of 1.53 percent.
Rates ticked up on the longer end of the yield curve, resulting in losses for longer-term Treasuries.
Both investment-grade and high-yield corporate bonds, however, managed to squeak out small gains for the week.
Commodities had a pretty good week, led higher by the roughly seven percent gain in oil prices.
And finally, the U.S. dollar ticked lower by about a third of a percent.
KEY CONSIDERATIONS
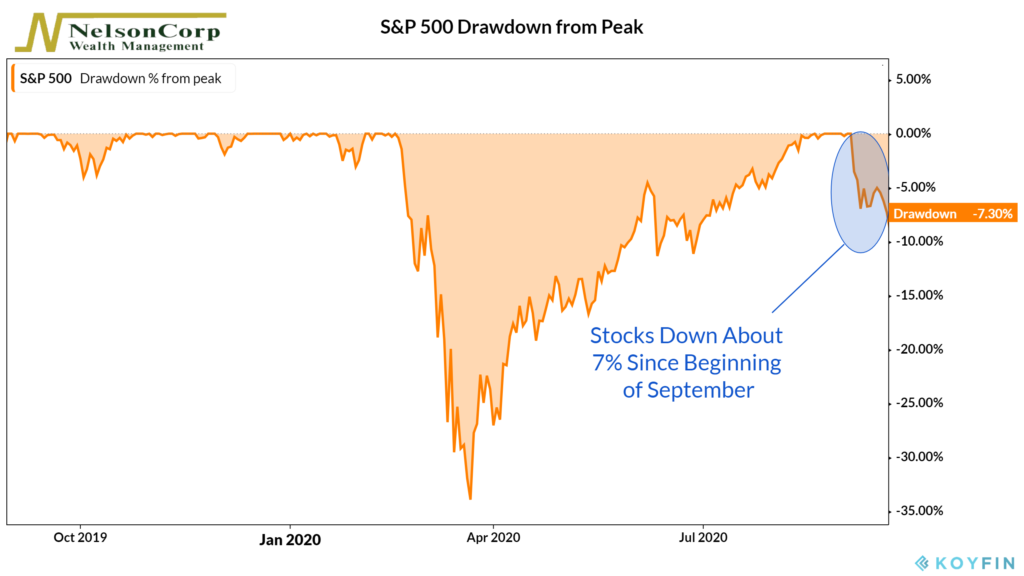
Stirring the Pot – Another down week for the U.S. stock market left the S&P 500 index in a roughly seven percent drawdown from its recent all-time high.
The selling has been a bit sporadic and choppy. But lately, we have received warnings that price momentum is slowing.
As the chart below shows, the one-year rolling returns for the S&P 500 index hit a peak of about 20 percent earlier this month. Since then, it has fallen to below 11 percent.
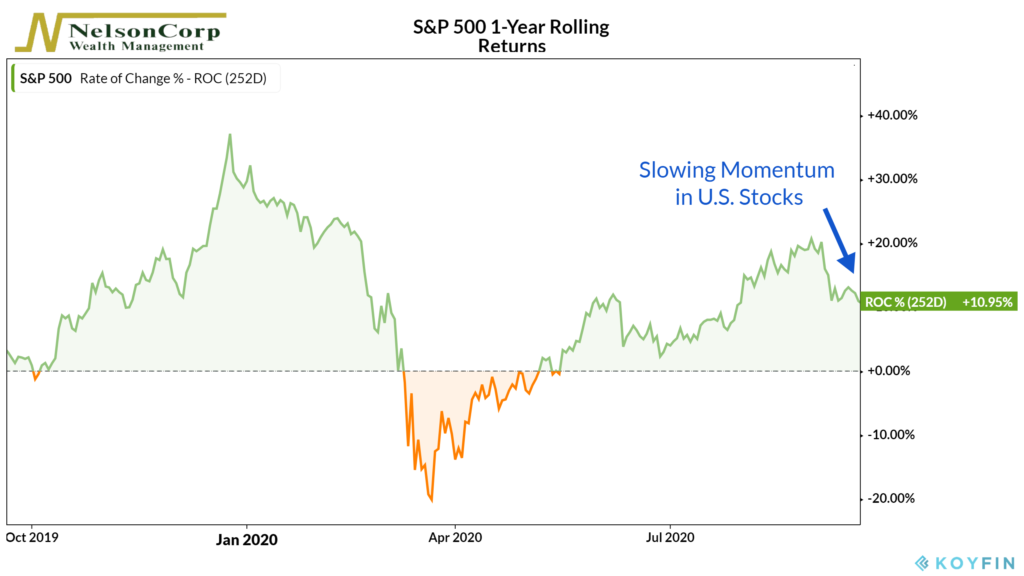
This type of deterioration is what we call a momentum reversal. It has historically led to weaker returns for the broader stock market.
We’ve also seen flows into equity ETFs hit extremely high (bearish) levels. The total amount of money flowing into U.S. equity ETFs over the past four weeks hit about $36.5 billion last week.
Historically, this has represented an extreme level of optimism that generates lower-than-average stock returns (unless flows come down to more moderate levels).
There are still plenty of positives, however.
A broader sentiment indicator that we track has come all the way down to a level of extreme pessimism. As sentiment cools off, we do expect selling pressure to ease as well.
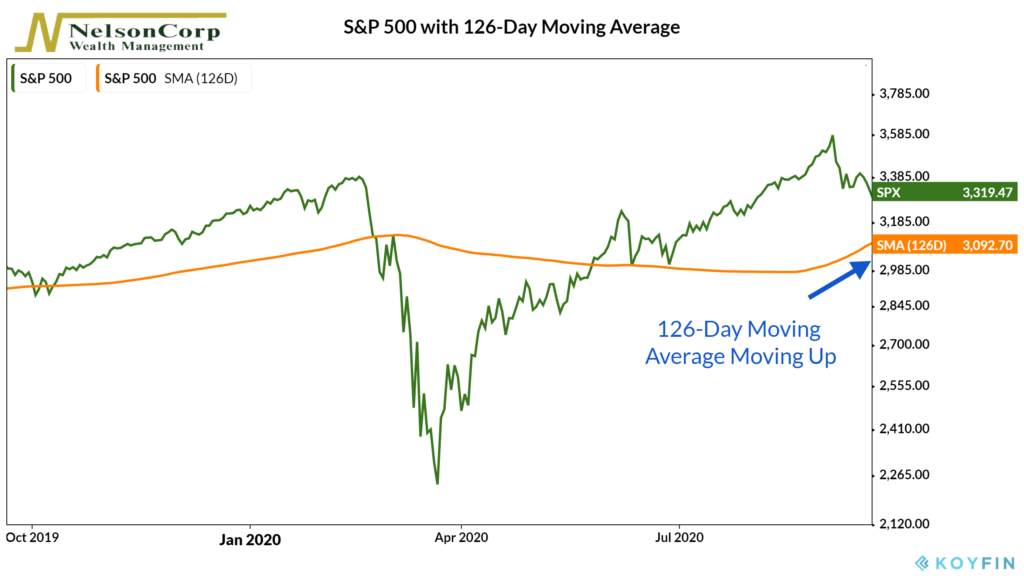
More so, the average price of the S&P 500 over the past six months (126 trading days) has turned up sharply in recent weeks, a bullish sign.
So, the pot has been stirred, but the weight of the evidence still leans positive.
If you threw all our indicators into a bag and randomly pulled out a few of them, you would likely see a decent mix of positive, neutral, and negative signals.
However, after enough draws, the tally would still be largest on the positive side of the ledger.
In fact, the positives would outweigh the negatives by about 2-to-1.
But this could all turn on a dime.
This time of year is generally a choppy one for financial markets. So now more than ever, it’s important to consider all the evidence and use our tools to help navigate the path forward.
This is intended for informational purposes only and should not be used as the primary basis for an investment decision. Consult an advisor for your personal situation.
Indices mentioned are unmanaged, do not incur fees, and cannot be invested into directly.
Past performance does not guarantee future results.