OVERVIEW
The U.S. stock market had another mixed week. While the tech-heavy Nasdaq rose 0.4%, the S&P 500 dropped 0.29% and the Dow fell 1.11%.
Among different stock categories, small-cap stocks had the poorest performance, dropping approximately 1.7% for the week. Value stocks followed closely behind with a decline of about 1.07%. On the other hand, growth shares saw an increase of 0.46%.
Foreign stocks had a down week as well. Both developed and emerging market stocks realized declines of about 0.8%.
In the Treasury market, short-term Treasuries managed to gain about 0.08%, while intermediate-term Treasuries dropped 0.17% and long-term Treasuries decreased 0.53%. Investment-grade corporate bonds were also down about 0.18%, while high-yield bonds fell by a smaller 0.05%.
Overall, commodities saw declines of about 1.7%, with oil and corn dropping about 1.5% but gold rising 0.5%. Real estate suffered declines of about 1.16%. And the U.S. dollar increased nearly 1.6% to conclude the week.
KEY CONSIDERATIONS
Stumbling Block – About a month ago, the S&P 500 stock market index started bumping up against the year-to-date high it reached in February. Equating to roughly 4200 on the index, this is a key technical level that, if breached, would be an encouraging sign that a bullish uptrend in the stock market is still intact.
However, the problem is that it’s been a month now, and the S&P 500 has yet to breach this level. Looking at a chart of the S&P 500’s daily returns, it appears the stock index has lost steam here, seemingly unable to find enough buyers to push prices higher.
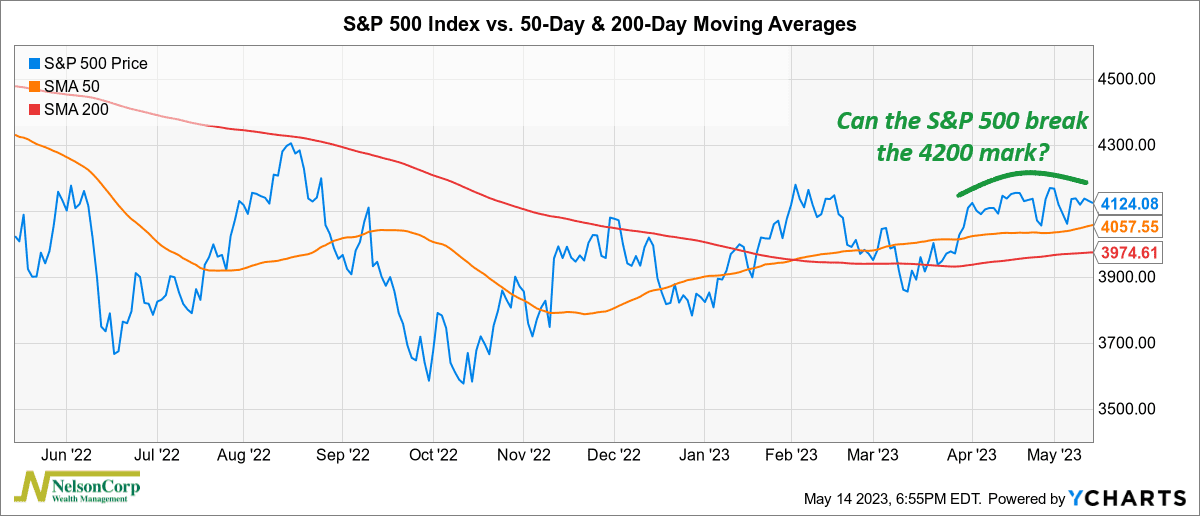
To be clear, the good news is that the stock market hasn’t completely fallen out of bed. It’s still trading above its 50- and 200-day moving averages, both of which are currently rising.
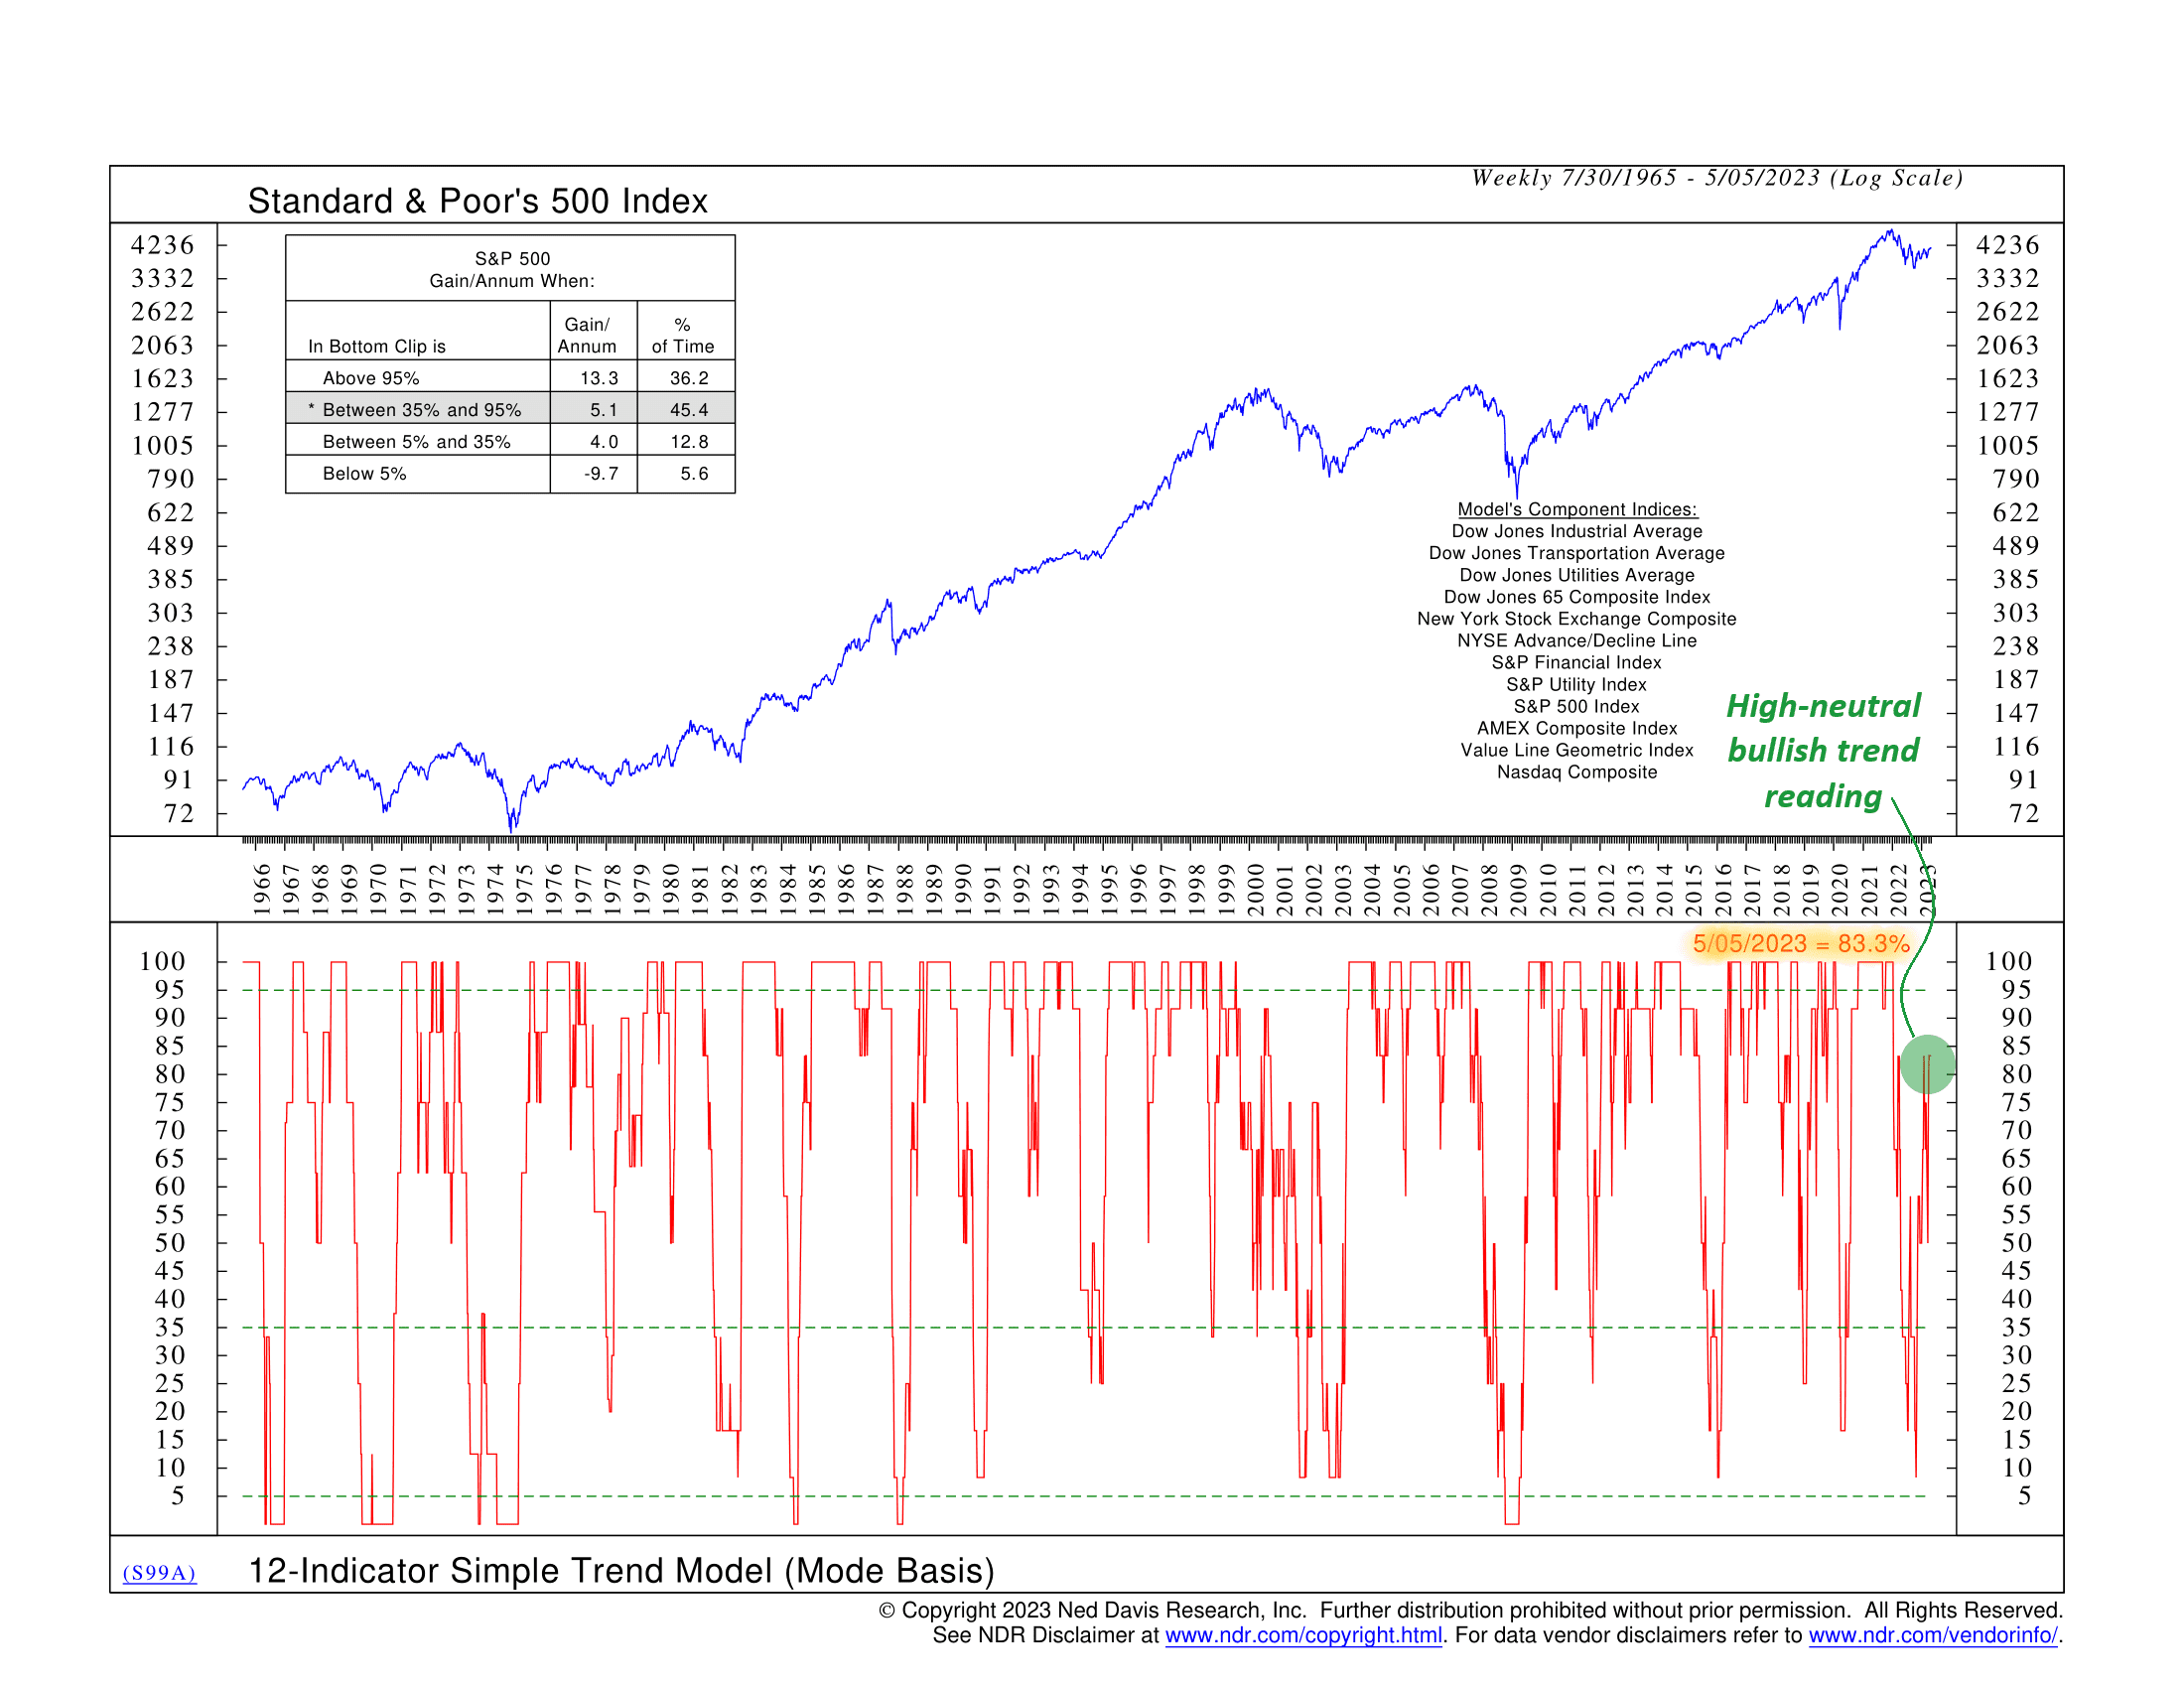
And on top of that, as discussed in our recent Indicator Insights blog post, multiple financial asset trends suggest that the current market environment is somewhat favorable for owning stocks (shown below).
Nevertheless, some notable headwinds are currently blowing straight at the market, which might explain why it’s had some trouble breaking out of its recent trading range. These headwinds include things like the debt ceiling dilemma this summer, slowing economic growth/a potential recession, and weak seasonality (as pointed out in this week’s Chart of the Week blog post).
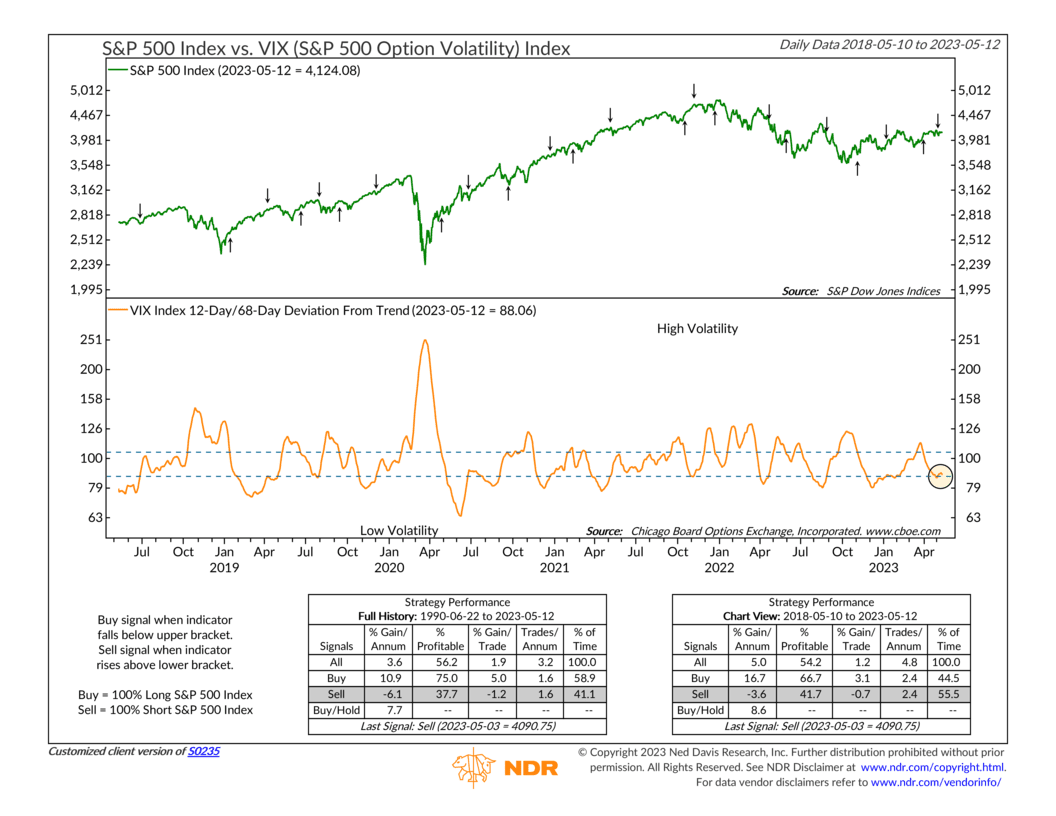
But a significant one, as far as our models are concerned, is the fact that investors are unusually complacent right now. I say this based on how we’ve seen the VIX Index—a measure of stock market volatility—trade lately.
One way to measure this is via the chart below, which shows the VIX Index with a deviation-from-trend indicator applied to it. This is calculated by dividing the 12-day moving average of the VIX by its 68-day moving average. When this measure falls below the lower dividing line and then rises back above it, it’s a negative signal for stock prices. Generally, this indicates that complacency is giving way to increasing fear.
Overall, the negative signal from this indicator and some other indicator changes have meant that our primary stock market risk model has hit a speed bump in recent weeks. As this next chart shows, the ratio of positive-to-negative indicators in the model dropped back below one last week.
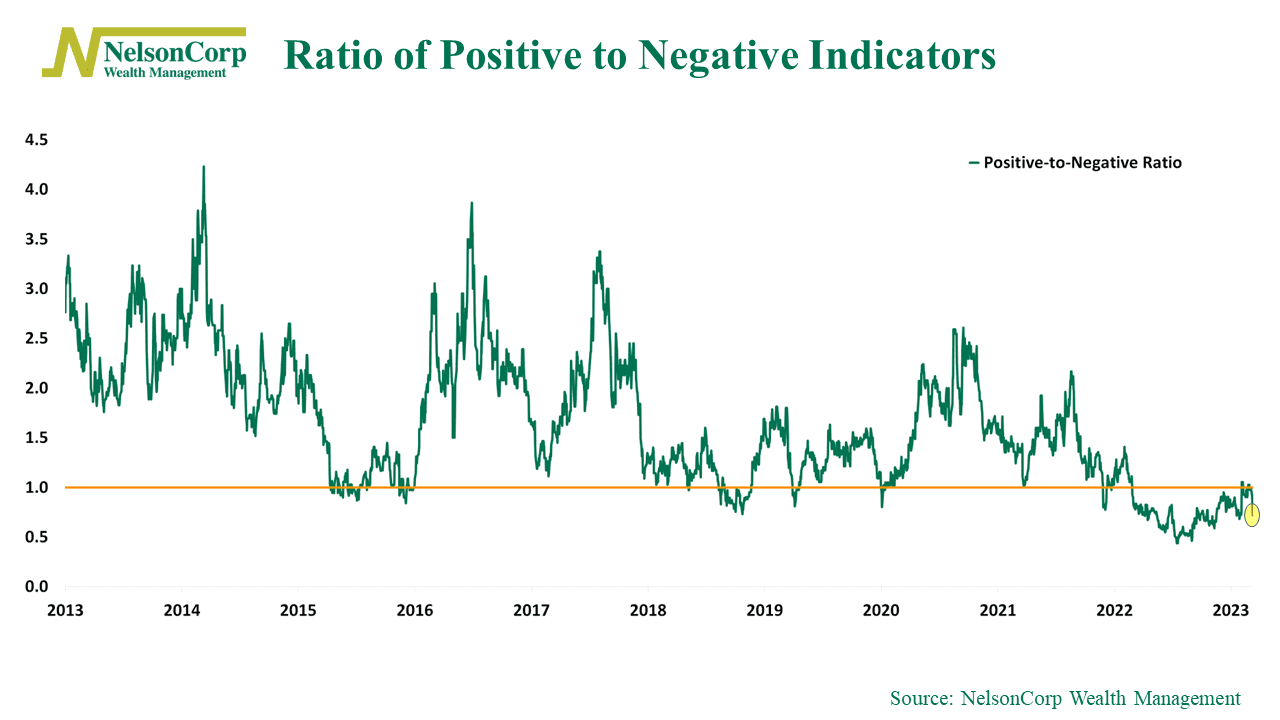
In other words, the model’s inputs aren’t currently moving in a positive direction.
So, looking at the big picture, we’ll have to see where the indicator evidence decides to go from here. Currently, the model’s output is mostly neutral, but it has deteriorated in recent weeks. We hope this is merely a stumbling block, but we will be closely monitoring the weight of the evidence as we move forward.
This is intended for informational purposes only and should not be used as the primary basis for an investment decision. Consult an advisor for your personal situation.
Indices mentioned are unmanaged, do not incur fees, and cannot be invested into directly.
Past performance does not guarantee future results.