OVERVIEW
The major U.S. stock indices ended the week on a mixed note last week. While the S&P 500 gained 1.43% and the Nasdaq surged 4.41%, the Dow lost about 0.15%.
Growth stocks led the way, gaining about 3.8% versus a 1.77% decline for value stocks. And while large-cap stocks were up 2.85%, small-cap stocks declined about 3.3%.
Foreign stocks were down; developed markets lost around 3.2%, and emerging markets fell about 0.4%.
The 10-year Treasury rate plummeted to 3.4% from 3.7% the week prior. The result was a rally in bond prices, as intermediate-term Treasuries gained 1.6%, long-term Treasuries rose 1.2%, and investment-grade corporate bonds gained 0.8%.
Oil dropped about 12.6% last week. Commodities as a whole were down around 1.87%, despite gold surging 5.8% and corn rallying 2.75%. The U.S. dollar weakened about 0.53% to end the week.
KEY CONSIDERATIONS
The Two I’s Turn Positive – For a while now, two boogeymen have been haunting the stock market: inflation and interest rates. Or, as I like to call them, the two I’s.
The two I’s feed off each other. When one rises or falls, the other tends to follow suit. And they both negatively affect stock prices when they rise unexpectedly.
For example, inflation—or increasing prices for goods and services—can decrease corporate profits and gross margins, resulting in lower stock prices as investors reprice assets.
Similarly, rising interest rates increase companies’ borrowing costs, affecting profitability. But also, higher interest rates mean lower discounted future cash flows. So, stock prices fall as, once again, investors reprice assets.
We model both inflation and interest rates to determine when the environment is either positive, neutral, or negative based on the weight of the evidence from the indicators. And for basically all of last year, both models were highly negative.
However, the good news is that both models are now in their upper bullish zones. In other words, the two I’s are a positive influence on stock prices now.
Here’s the Interest Rate model.
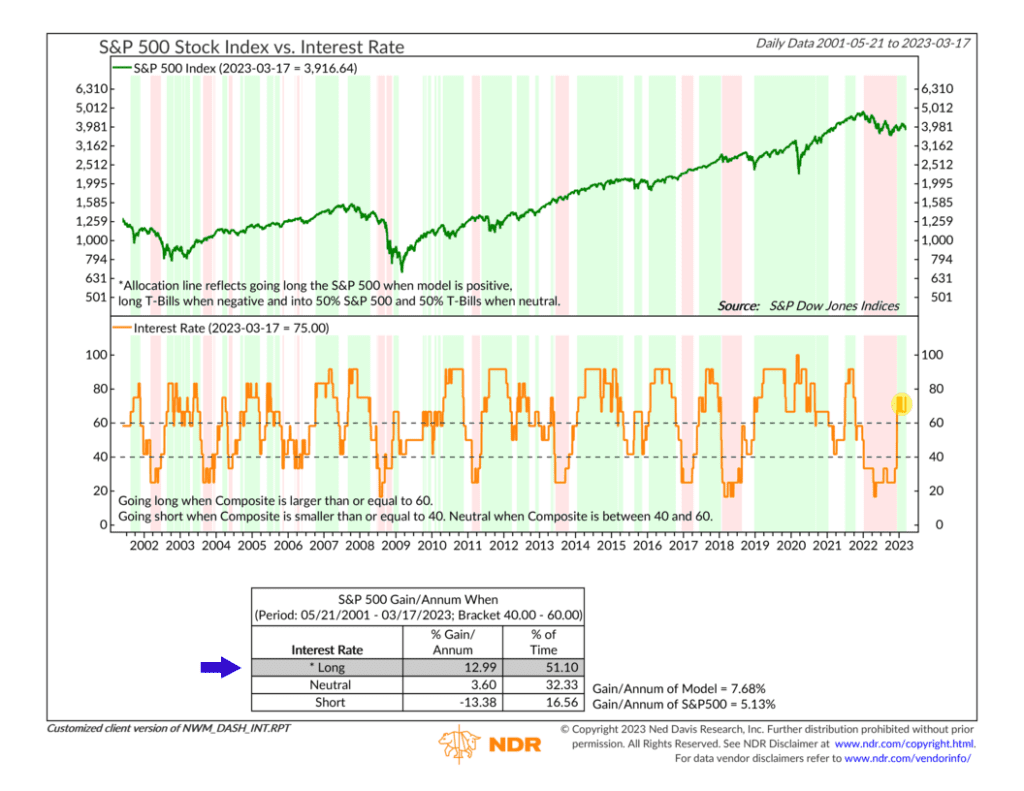
It turned positive near the end of last year as various indicators began to point to a peak in rates. In fact, the 10-year Treasury rate—shown below—hit a wall when it reached 4.25% last October.
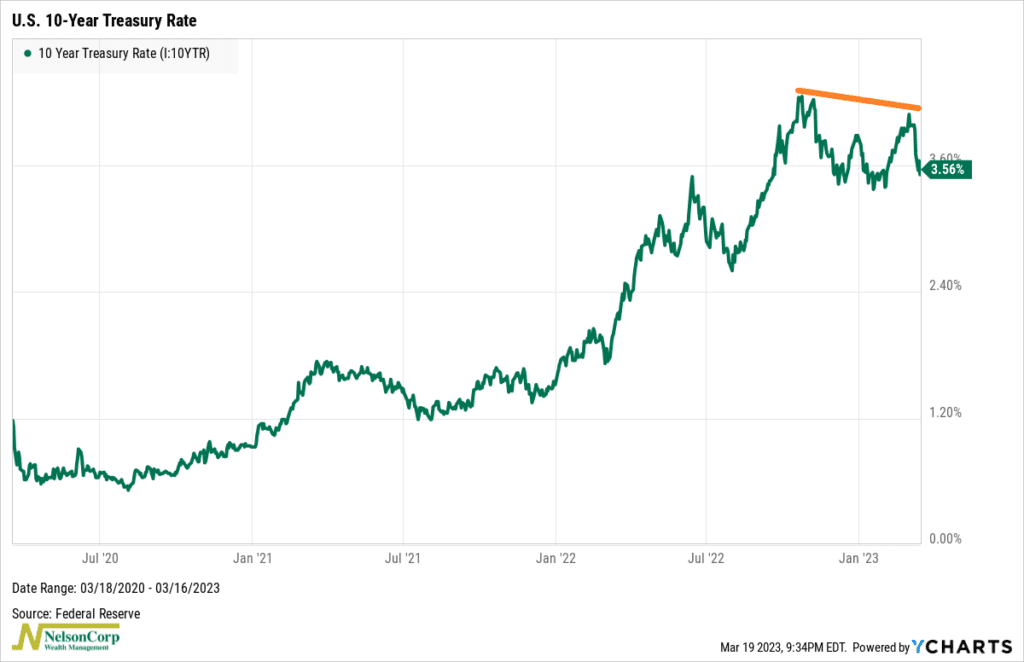
Rates have fluctuated since, but the pause has helped keep stock prices buoyant.
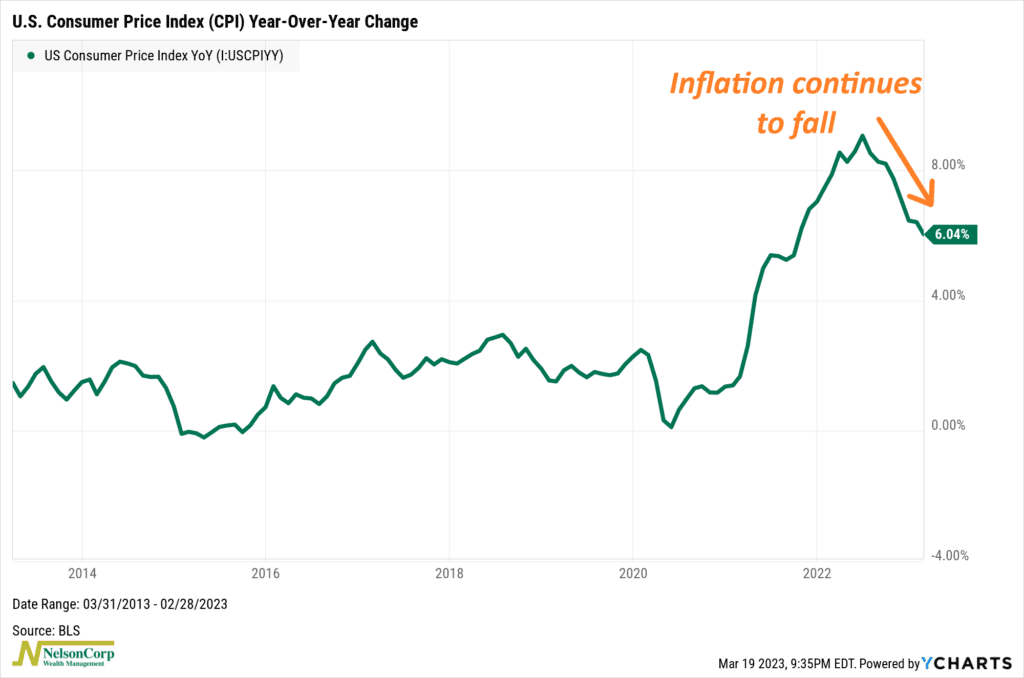
As for inflation, the data also point to a peak in its annual rate of increase. The headline CPI reading, shown below, peaked at 9.06% last summer and continues to fall.
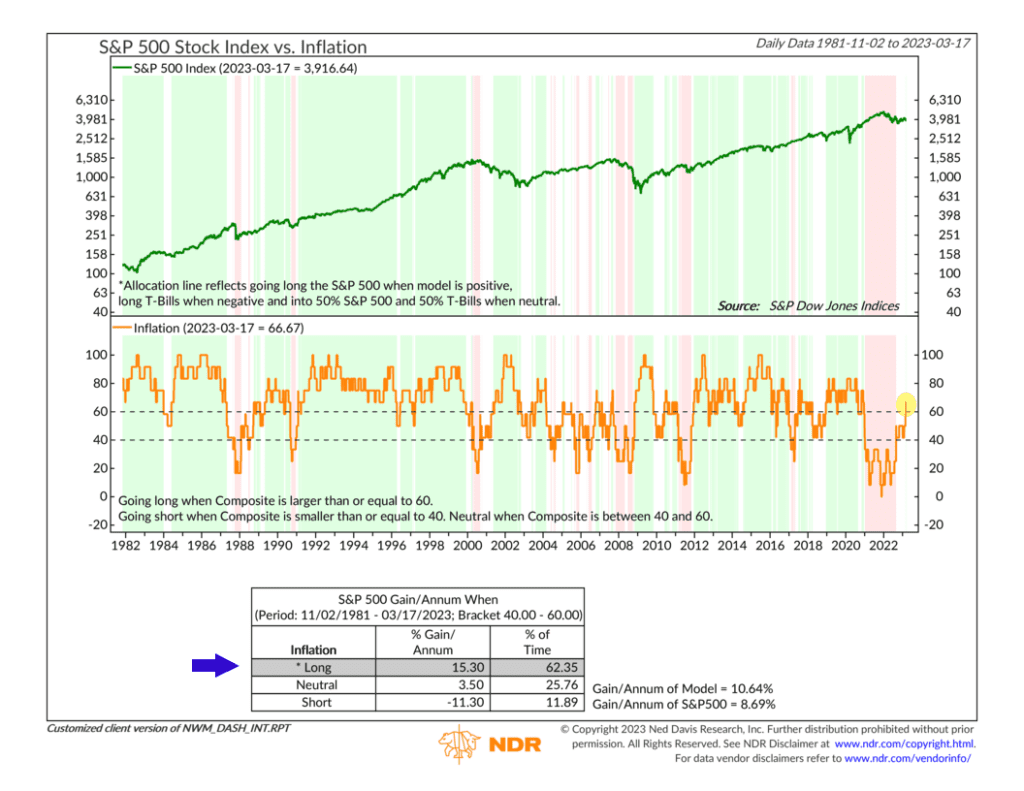
Our Inflation model, shown below, recently jumped into its upper bullish zone. This is the highest it’s been since the end of 2020. Based on historical tendencies, this sort of inflation environment has been a positive one for stock market returns.
The bottom line? The two I’s—inflation and interest rates—are key inputs into the Economic Environment composite of our primary stock market risk model. Recent improvements in the two I’s have resulted in a neutral reading for our Economic Environment composite—shown below.
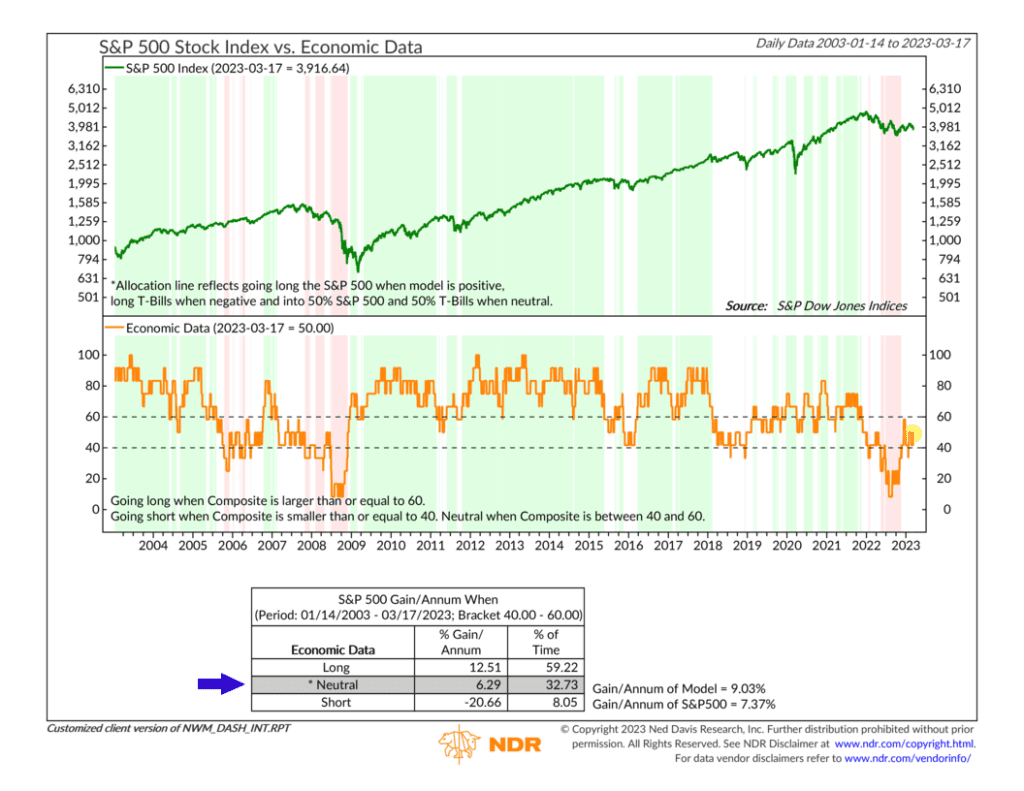
Historically, this environment has produced decent returns for the stock market, roughly in line with its long-run average.
This is intended for informational purposes only and should not be used as the primary basis for an investment decision. Consult an advisor for your personal situation.
Indices mentioned are unmanaged, do not incur fees, and cannot be invested into directly.
Past performance does not guarantee future results.