OVERVIEW
The U.S. stock market fell again last week, marking its third consecutive week of losses. The S&P 500 dropped 2.67%, the Dow dipped 2.99%, and the Nasdaq declined 3.33%.
Foreign stocks didn’t fare much better, with developed country stocks decreasing 2.48% and emerging markets dropping 2.76%.
An increase in bond yields resulted in declines for most bonds last week. While short-term Treasuries increased slightly by 0.07%, intermediate-term Treasuries fell 0.76%, and long-term Treasuries slipped 1.33%. Investment-grade corporate bonds also lost around 1%, and high-yield (junk) bonds declined by about 0.17%.
Real estate had a down week, tumbling about 3.88%. Commodities also fell broadly by roughly 0.92%. Although oil was up about 0.12%, gold fell 1.8%, and corn plummeted 4.17%. However, the U.S. dollar increased by 1.42% against the world’s major currencies.
KEY CONSIDERATIONS
Trying to Trend – The stock market has felt the pressure in recent weeks. The S&P 500 index has now given back about half its gains since the start of the year. This makes it hard to say with 100% certainty that last year’s downtrend has been broken.
But still, a positive sign is that the rally from the October lows has been strong enough that the S&P 500’s average 200-day price—shown as the orange line on the chart below—has finally started to flatten out and has nearly stopped falling.
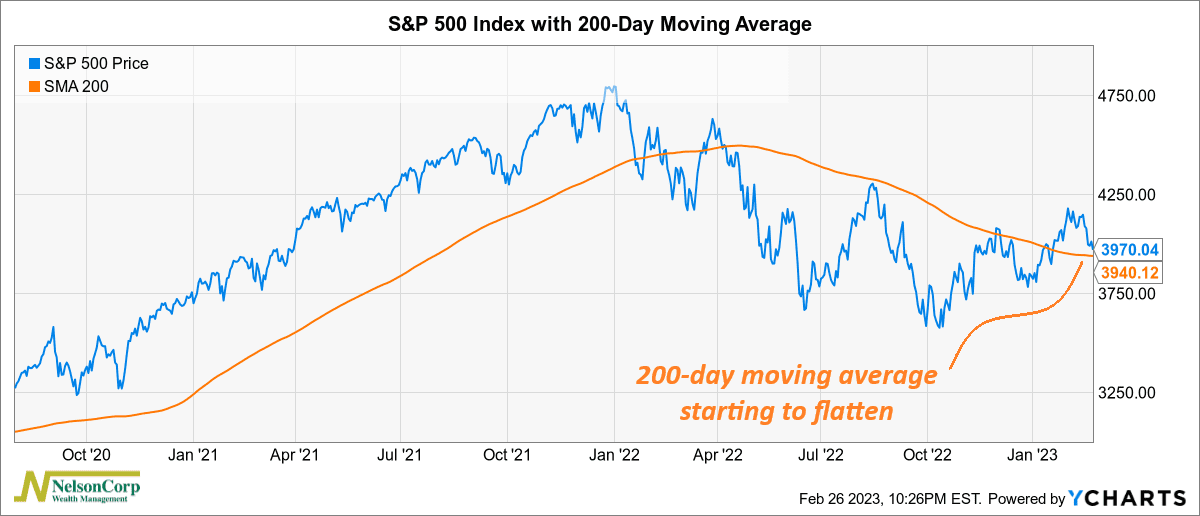
Unfortunately, another poor performance last week means that the index is back to testing its 200-day average price. In all likelihood, the market needs to stay above this key technical level to help sustain a bullish rally.
Nonetheless, one good thing about the new-year rally is that it has been accompanied by a “risk-on” attitude in the market.
For example, the following chart shows the performance of low beta (less volatile) stocks relative to high beta (more volatile) stocks. Since the October 2022 lows, high-beta stocks have outperformed low-beta stocks, as evidenced by the falling orange line.
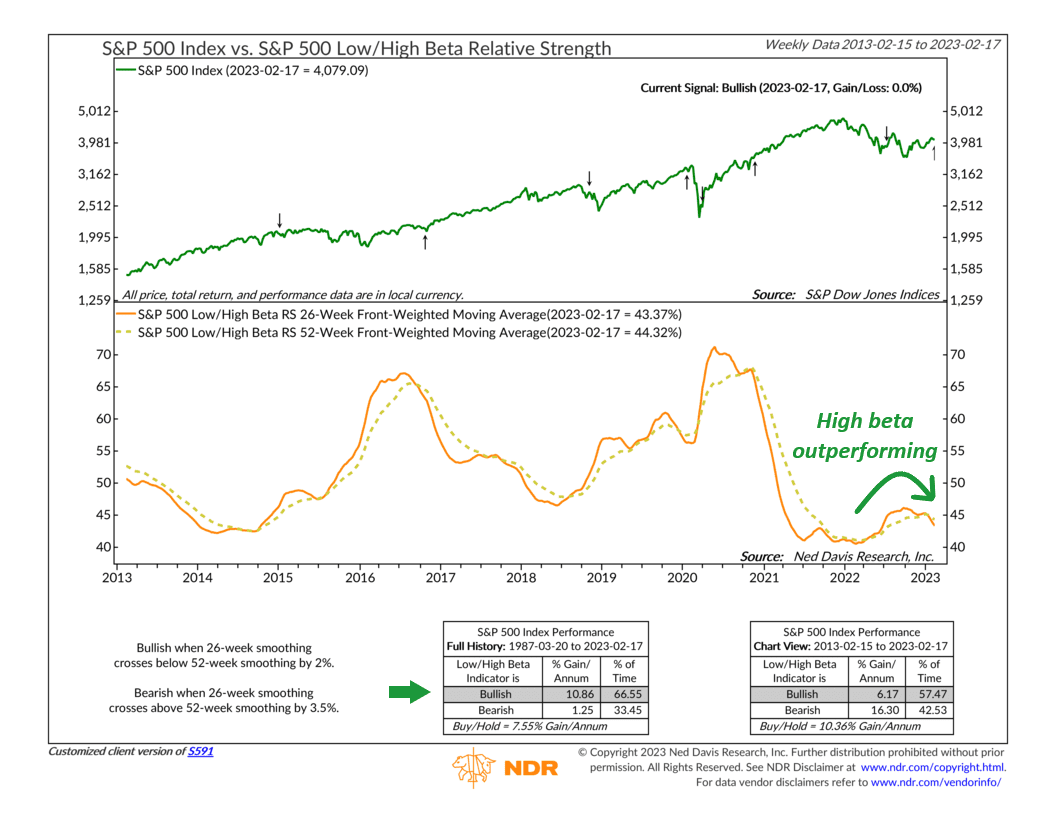
When this basket of more volatile stocks outperforms, it shows increased risk-taking among investors. In general, this sort of environment is conducive to strong gains for the broader stock market.
But, of course, no rally is perfect. There are still areas of concern.
Take the 85-day stochastic indicator—shown below—as an example. At the beginning of February, it reached its highest level since November 2021—a sign of a highly overbought market.
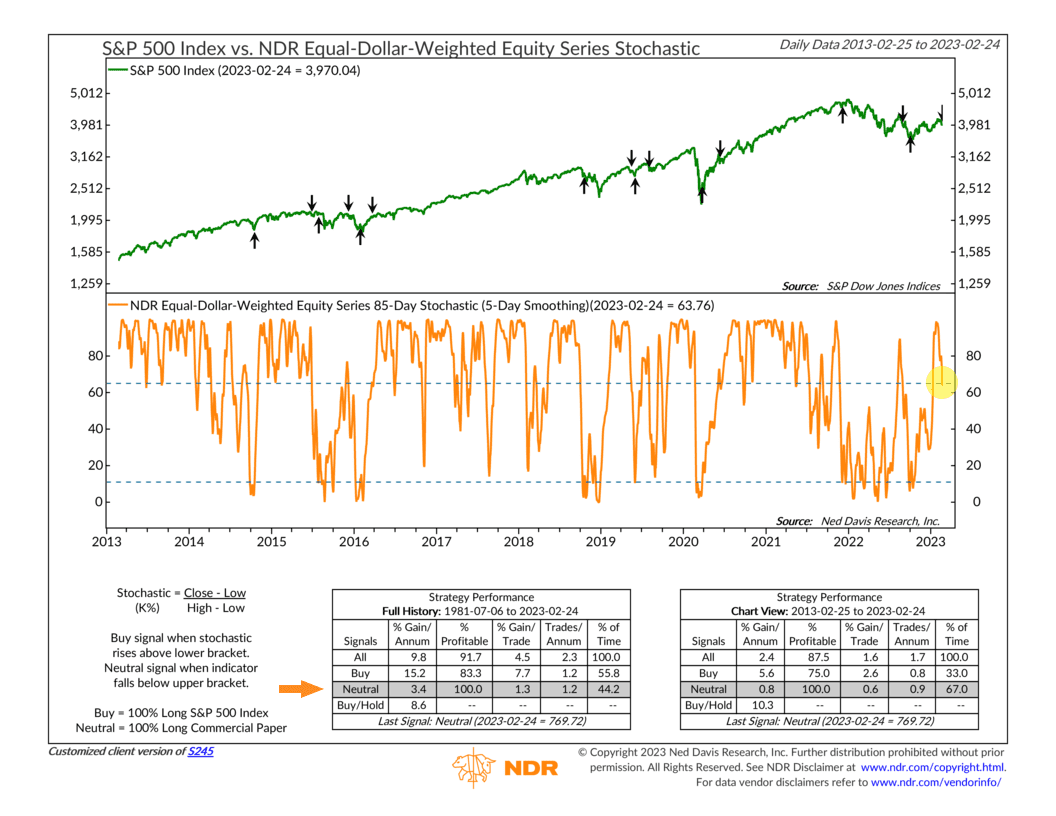
And then, last Friday, it fell below the upper bracket line, triggering a sell signal for the stock market. At this point, the path of least resistance for the S&P 500 is likely downward. (Although, this indicator can go neutral if it rises back above the upper bracket line from here, so a rally could still technically be sustained.)
The bottom line, though, is that history tells us that the market doesn’t always trend strongly in one direction; in fact, a lot of the time, it kind of treads water or just moves sideways. For roughly a year now, that’s pretty much what it has been doing.
To be sure, the accumulation of evidence since the October lows suggests that the market would like to continue in an upward trajectory, but some more indicator improvement is likely still needed.
This is intended for informational purposes only and should not be used as the primary basis for an investment decision. Consult an advisor for your personal situation.
Indices mentioned are unmanaged, do not incur fees, and cannot be invested into directly.
Past performance does not guarantee future results.