In the current era of meme stocks, it can be easy to forget that the underlying companies in the stock market are real businesses with real profits and cashflows—and that sometimes they choose to pay those cashflows out to investors in the form of dividends. Unlike earnings, which corporate accountants can easily manipulate, dividends are (mostly) paid in cash and so are hard to fake. If you compare how much a company is paying out in cold hard cash (dividends) relative to its stock price, you can figure out whether the stock is over or undervalued.
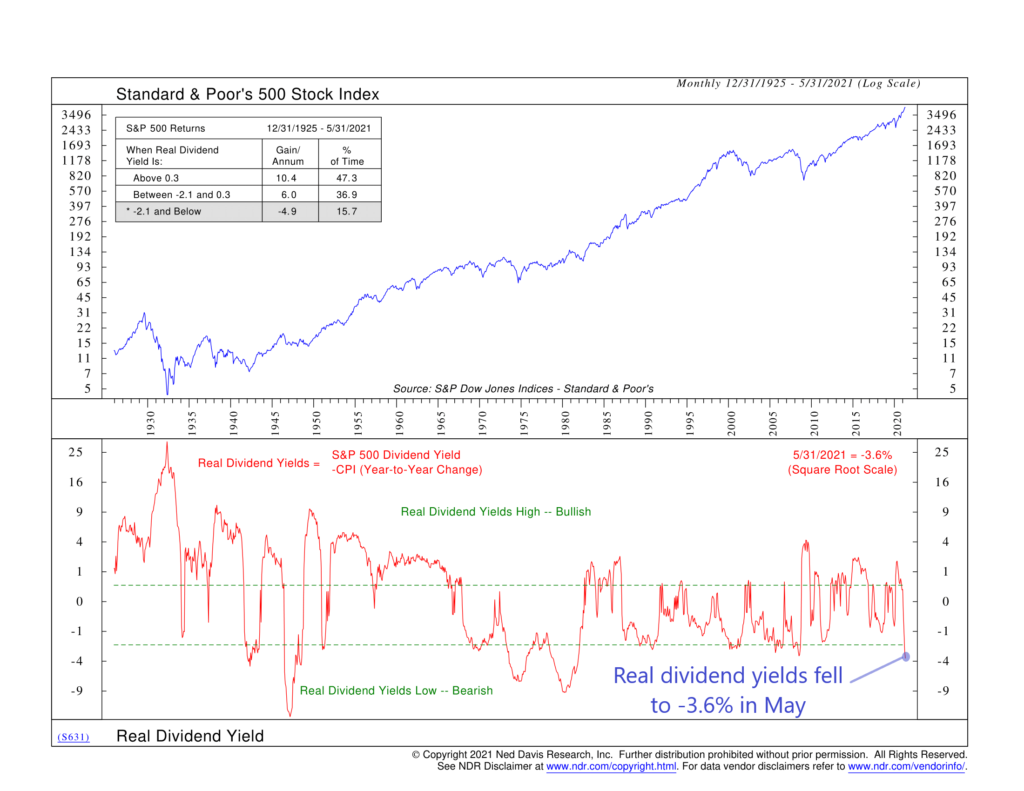
That’s what our featured indicator above does. It first computes the dividend yield of the S&P 500 stock index as a whole. This is done by taking the dividend per share of the index and dividing it by the price of the index. Displayed as a percentage, this can be thought of as the money the companies in the S&P 500 are paying to shareholders for owning the stocks relative to the index’s price.
But this indicator takes it one step further and then subtracts out the year-to-year change in the Consumer Price Index (CPI), a commonly followed measure of inflation. This is how we get the “real” in the real dividend yield moniker. Since dividends are a form of income for an investor, it makes sense to look at the dividend yield net of the loss to purchasing power that comes from inflation.
Here’s where it gets interesting. The analysis shows that, historically, when the real dividend yield gets above about 0.3%, it’s a sign that stocks are undervalued. In other words, the amount of income that investors are receiving from companies net of inflation is high relative to the price they are paying for the shares. Returns have been north of 10% per year, on average, for the S&P 500 index when the real dividend yield is at these levels.
But it cuts both ways. When the real dividend yield falls below about -2%, it’s a sign that stock prices are much too high relative to the underlying dividends they are paying out net of inflation. Historically, going back to 1925, the S&P 500 has had negative returns, on average, when the real dividend yield is that low.
That’s what makes the most recent reading for the indicator so interesting. The dividend yield for the S&P 500 index has been steadily falling since March of last year and is currently about 1.4%. The most recent CPI release for May revealed an increase in inflation of 5% from a year ago. So, when we subtract this out of the S&P 500’s dividend yield of 1.4%, we get a real dividend yield of -3.6%. This is below the lower bracket line of -2%, indicating an overvalued market. Historically, returns have suffered at these levels, so this is certainly something to be aware of.
This is intended for informational purposes only and should not be used as the primary basis for an investment decision. Consult an advisor for your personal situation.
Indices mentioned are unmanaged, do not incur fees, and cannot be invested into directly.
Past performance does not guarantee future results.