This week, we show a chart of the long-term relative performance of small-capitalization stocks versus large-capitalization stocks. A small-cap stock is one in which the underlying company has a market capitalization of under $2 billion. Whereas a company with a market capitalization of more than $10 billion is considered a large-cap stock. (Market capitalization, if you’re wondering, refers to the total dollar market value of a company’s outstanding shares of stock—calculated by taking the current price of the stock and multiplying it by the total number of shares outstanding).
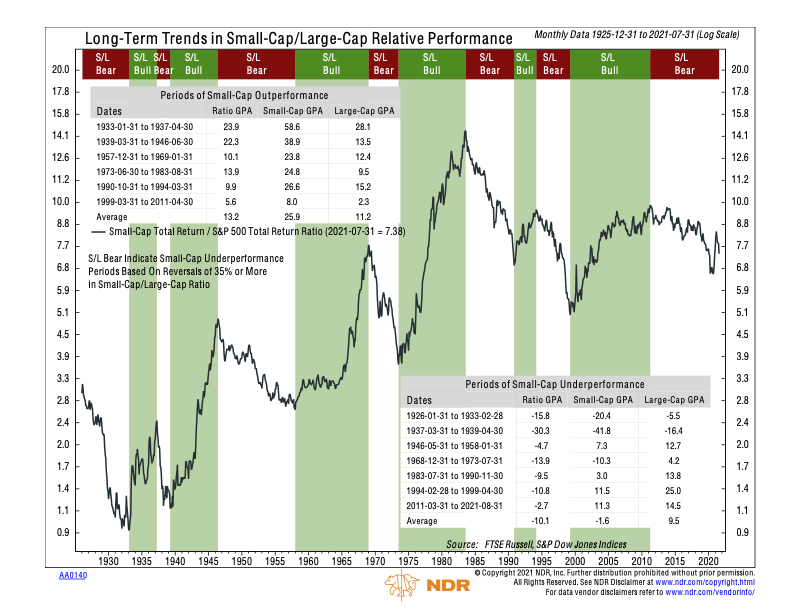
The black line on the chart represents the ratio between the Russell 2000 Total Return Index (small-cap stocks) and the S&P 500 Total Return Index (large-cap stocks). The green shaded areas denote the periods when small-caps are outperforming large-caps over a long-term time period, so the ratio is going up. However, when the ratio is going down, it means large-caps are in a period of long-term outperformance versus small-caps.
A few things stand out when looking at the chart. For one, small-caps have outperformed large-caps over the whole history of the chart, going back to the 1930s. From a risk standpoint, this probably makes sense. Smaller companies offer higher growth potential (they still have a lot of room to grow), but they are also higher risk because not every business will go on to become a large, profitable company. In theory, the higher risk should come with a risk premium in the form of higher expected returns.
However, another thing that stands out is that the small-cap-to-large-cap ratio peaked in the mid-1980s and has been coming down ever since. Sure, small-caps had a nice run in the first decade of the 2000s, but since 2011 we’ve seen large-caps outperform small-caps by a decently sized margin. Even that big pop in the ratio earlier this year, when small-caps outperformed large-caps, wasn’t a big enough reversal to change the long-term trend—and the ratio is heading lower once again.
It’s all probably a sign of the times. Some of the well-known tech companies born during or after the tech boom have matured and graduated to the big leagues—and now they dominate the marketplace like never before. It will be interesting to see if they can continue to push the small-cap-to-large-cap ratio lower as we roll into the new decade.
This is intended for informational purposes only and should not be used as the primary basis for an investment decision. Consult an advisor for your personal situation.
Indices mentioned are unmanaged, do not incur fees, and cannot be invested into directly.
Past performance does not guarantee future results.