by NelsonCorp | Jun 5, 2025 | Indicator Insights
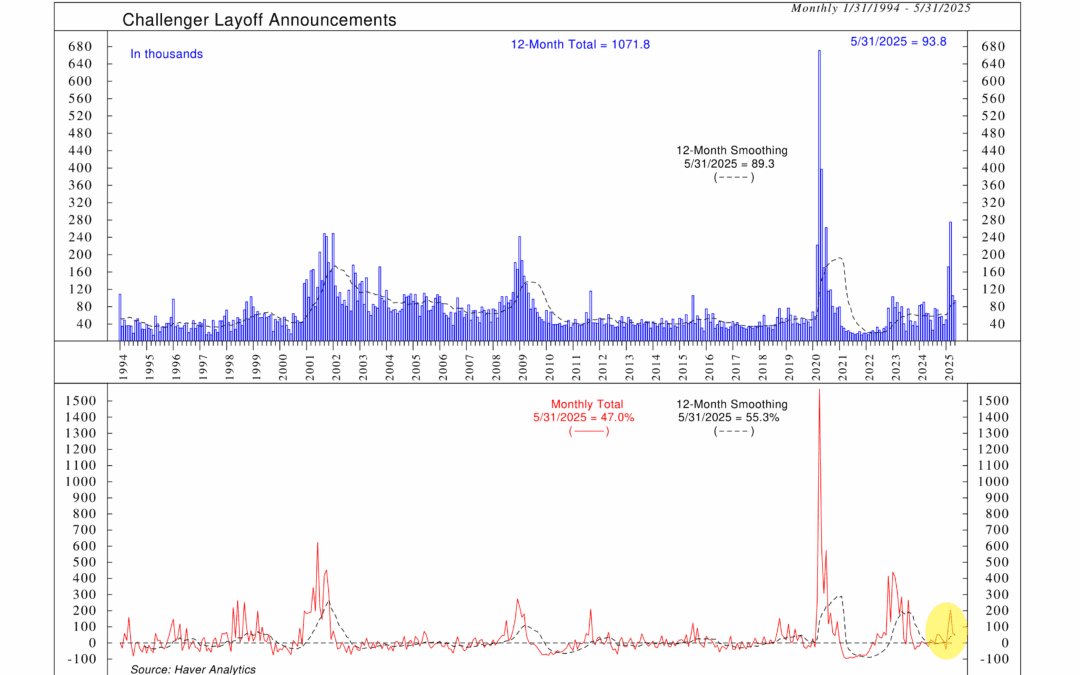
Layoffs are on the rise, and one of our favorite early-warning indicators is flashing yellow. While the broader economy still looks healthy, the recent surge in announced job cuts could be the first crack in the labor market’s foundation.
by NelsonCorp | May 30, 2025 | Indicator Insights
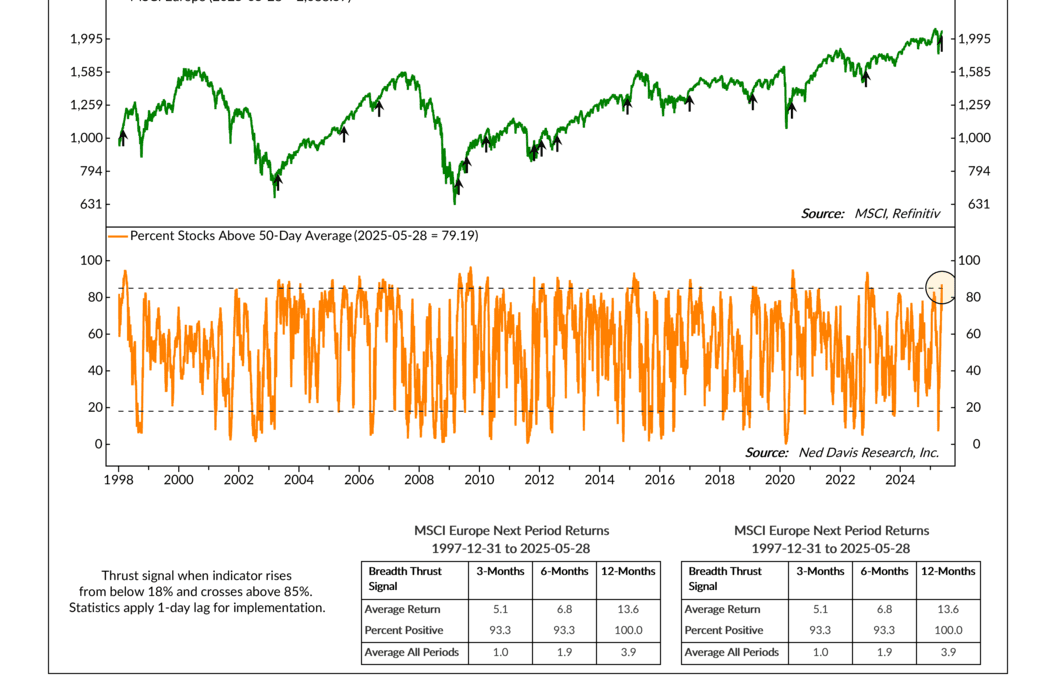
Most investors keep their eyes on the U.S.—but sometimes, the real story is happening elsewhere. This week, a rare and powerful signal just flashed in European markets, and history says it’s one worth watching.
by NelsonCorp | May 22, 2025 | Indicator Insights
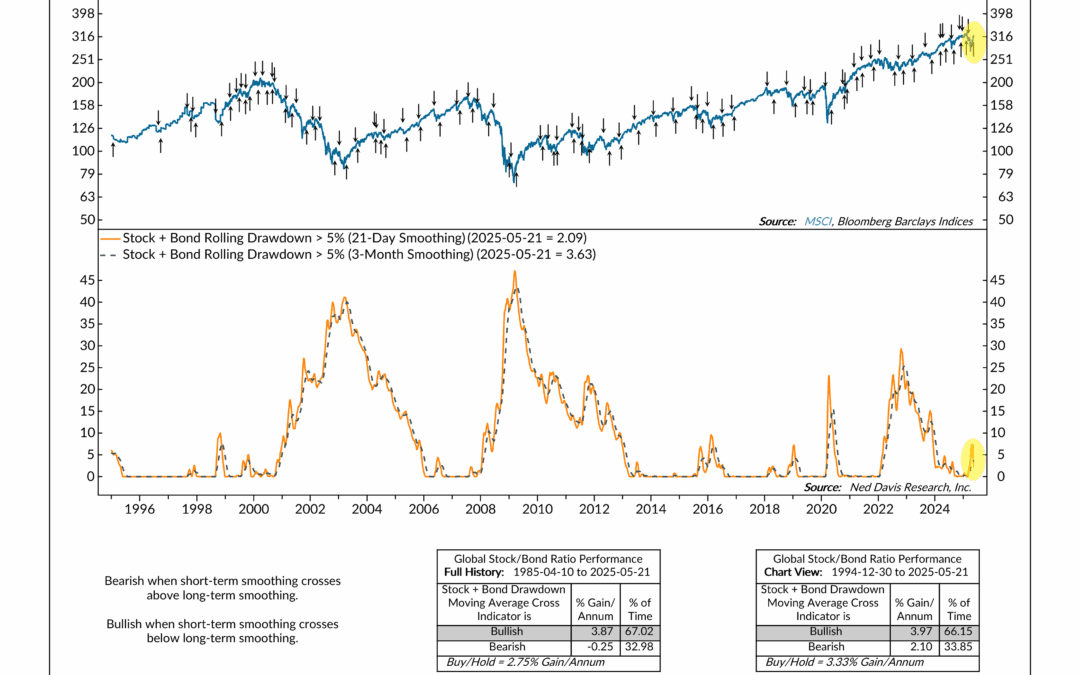
Stocks and bonds came under pressure earlier this year—but this week’s indicator suggests the worst of the pain might be behind us. A new bullish signal just triggered, and history shows it often shows up right as markets begin to recover.
by NelsonCorp | May 15, 2025 | Indicator Insights
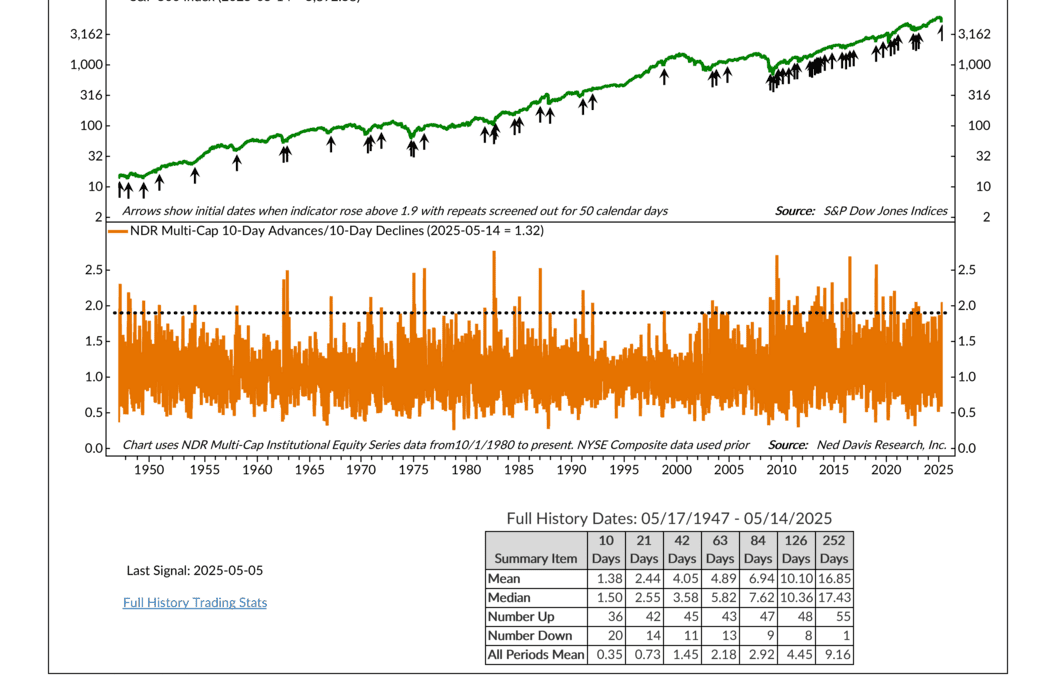
Houston, we have thrust! That’s right, this week’s indicator is all about thrust. But I’m not talking about a rocket ship—I’m talking about the stock market. Specifically, I’m referring to market breadth and how it can be used to generate an upside “thrust”...
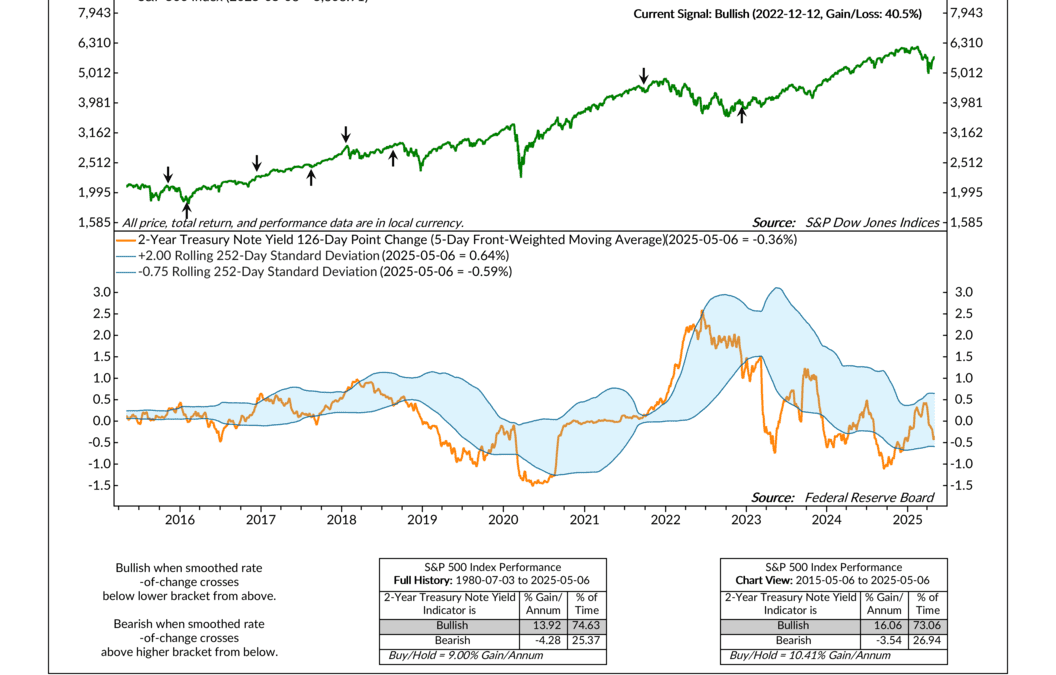
by NelsonCorp | May 7, 2025 | Indicator Insights
So, the Fed came out this week and reiterated that they’re keeping rates where they are for now. You know, watching the data, that kind of thing. But if you look at what the bond market’s doing, it’s saying something different—and that’s the topic of this...
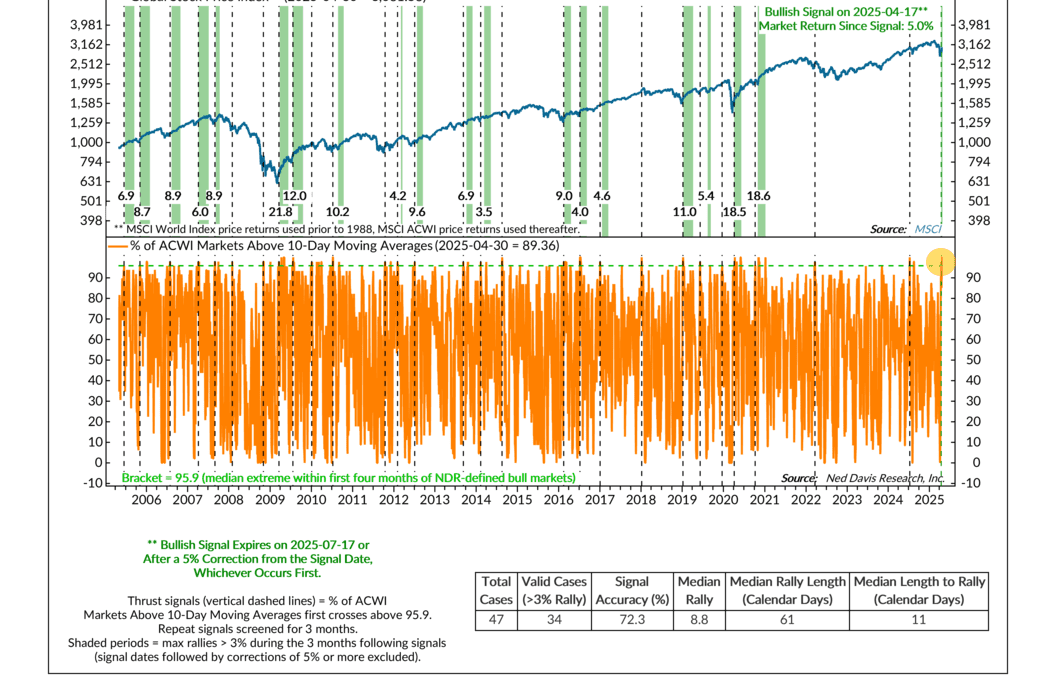
by NelsonCorp | May 1, 2025 | Indicator Insights
After a rocky few months to start the year, we finally got some good news a few weeks ago: a global breadth thrust. What’s that? Simply put, it’s when a big chunk of global stocks all start moving higher at the same time—and in a relatively short period. In the...