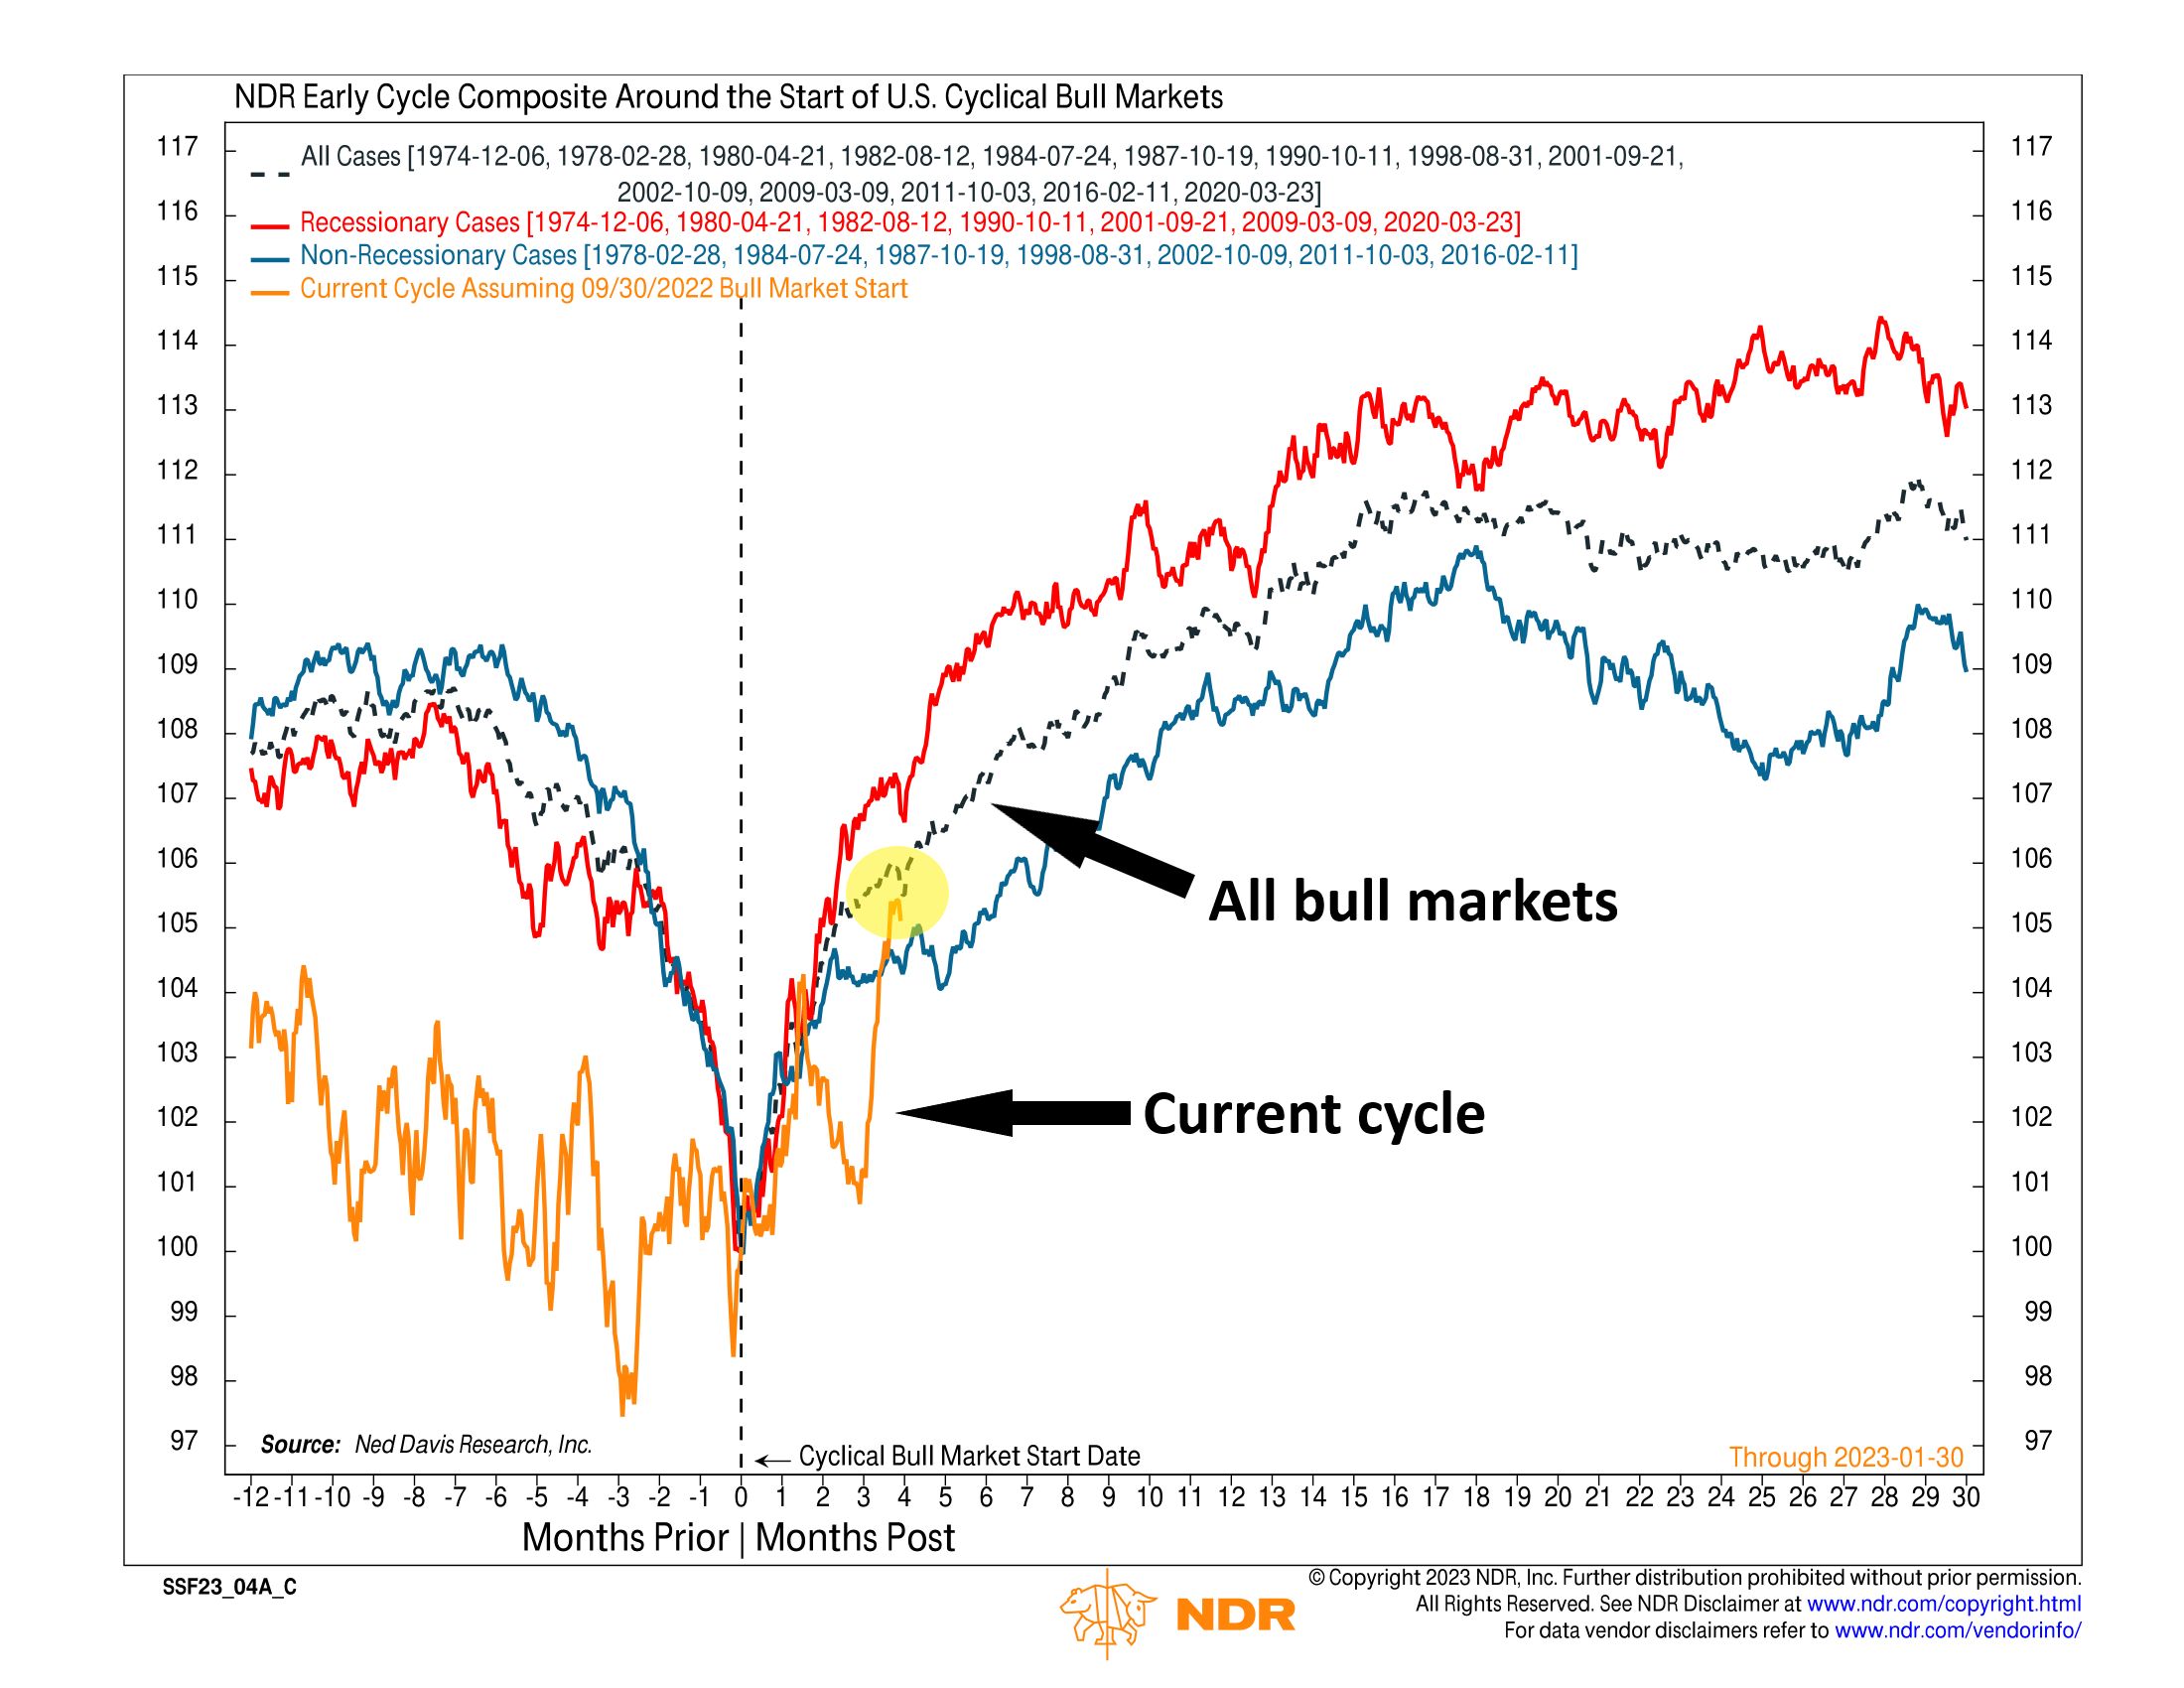
The stock market is acting like it’s in the early stages of a bull market. That’s the message from the Early Cycle Composite, shown on the chart above.
This chart looks at the stocks and sectors that tend to lead in the early stages of a bull market—call these the early cycle leaders. The black line represents the average performance of these early cycle leaders around the start of all bull markets. The red line is the average performance following a bear market with a recession, and the blue line is the average performance following a bear market without a recession.
The orange line is the current cycle, or the current performance of these early cycle leaders, assuming a start date of 9/30/2022 (the lowest point the Dow has reached this cycle). As you can see, after trailing in the fourth quarter, the early cycle leaders have caught up with the average performance line—and surpassed the non-recessionary case.
The takeaway? This is good news for the idea that a new bull market is forming.
To be sure, we aren’t saying that the bear market is over. The ratio of oversold-to-overbought stocks—a component of the Early Cycle Composite—is still trailing the average bull cycle case by a wide margin. More work needs to be done there.
But the evidence is starting to tilt towards the bullish side of the ledger. Continued outperformance from these early cycle-leading stocks and sectors in the next few months would build a strong case for a new cyclical bull market.
This is intended for informational purposes only and should not be used as the primary basis for an investment decision. Consult an advisor for your personal situation.
Indices mentioned are unmanaged, do not incur fees, and cannot be invested into directly.
Past performance does not guarantee future results.