The Covid-19 pandemic has drastically changed how Americans spend their money, at least for the time being.
Total consumption since the pandemic began is down around 5 percent.
However, if we dig into the weeds, we see that Americans have spent about 12 percent more on durable goods (cars, appliances, furniture, etc.) and about 9 percent less on services than before the pandemic.
The growth rates of these two spending categories paint a similar picture.
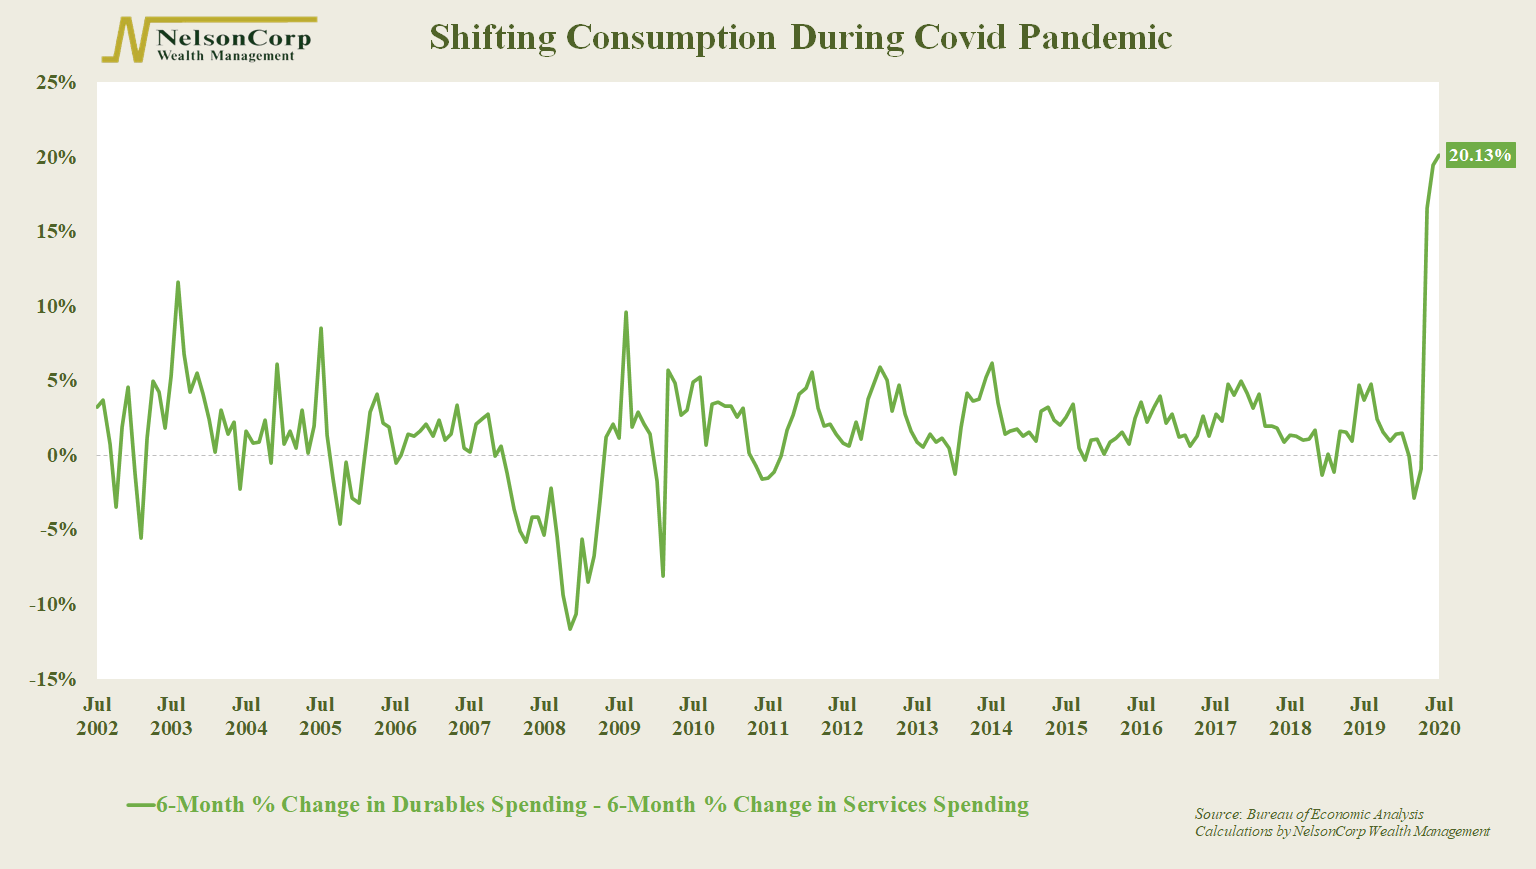
Our chart of the week shows the difference in the 6-month percentage change in spending on durable goods versus services.
In July, the latest month of available data, the 6-month growth rate in spending for durables was 10.47 percent, whereas services fell 9.66 percent.
That difference of 20.13 percent is by far the largest on record.
This makes sense. The virus has made it much less desirable to go out and spend money on services, such as movie dates, haircuts, restaurants, and plane rides.
But spending on big-ticket items (durables) surged as government backstops helped put more money into people’s pockets.
Still, you can only buy so many washing machines and used cars. And as the government’s stimulus tapers off, spending patterns will likely shift again.
This is intended for informational purposes only and should not be used as the primary basis for an investment decision. Consult an advisor for your personal situation.
Indices mentioned are unmanaged, do not incur fees, and cannot be invested into directly.
Past performance does not guarantee future results.