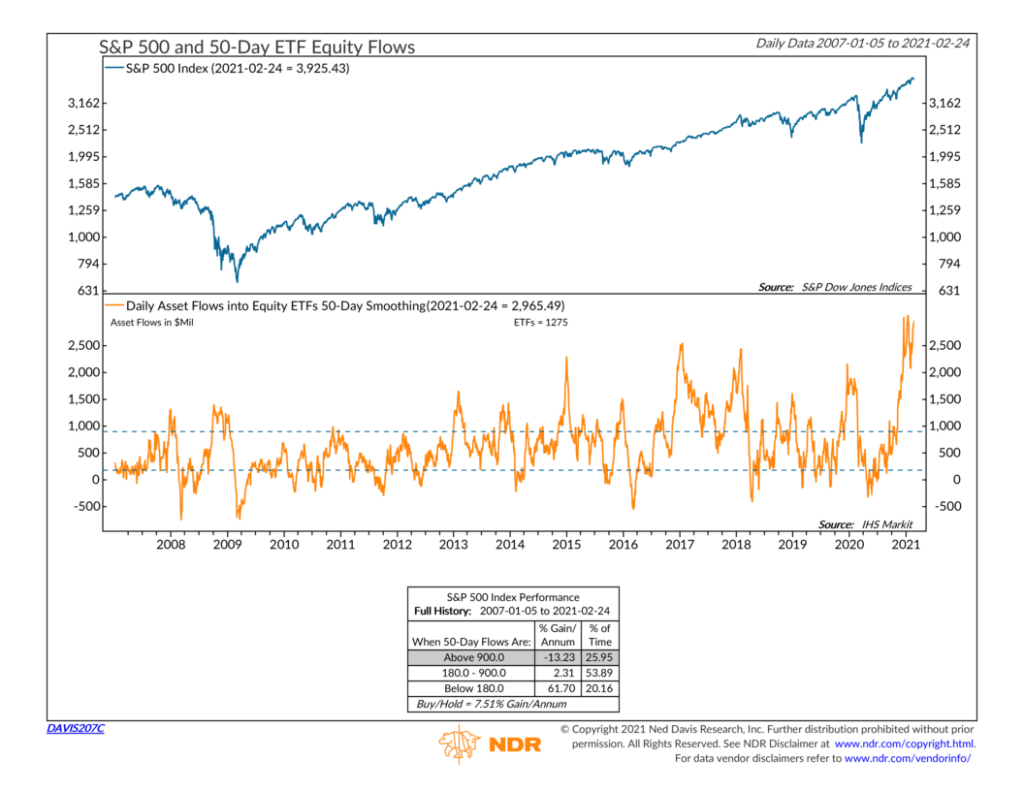
Investors have been buying into stock funds at a frenzied rate lately. As our chart of the week above shows, the 50-day average of daily inflows into U.S. stock funds has hovered above $2 billion a day for over two months now. About a month ago, that number was more than $3 billion a day, and the most recent reading was just shy of that peak.
So, what does this mean? Historical analysis shows that this is another case of too much of a good thing being bad and vice versa. The return boxes on the indicator reveal that when the 50-day average of daily inflows into stocks has been above $900 million, the S&P 500 stock index has had negative average annual returns. But when the inflows are less than $180 million or even negative, the S&P 500 has posted monster average annual returns—north of 60%!
Indeed, the large stock inflows we’ve seen recently have been accompanied by some weakness in the broader market. Rising long-term rates have led to a bit of a rotation out of the high-flying tech funds and into more value-oriented sectors, such as financials.
Whether this trend continues remains to be seen, but our chart above suggests that flows will likely need to cool off a bit for the broader market to see any significant gains going forward.
This is intended for informational purposes only and should not be used as the primary basis for an investment decision. Consult an advisor for your personal situation.
Indices mentioned are unmanaged, do not incur fees, and cannot be invested into directly.
Past performance does not guarantee future results.