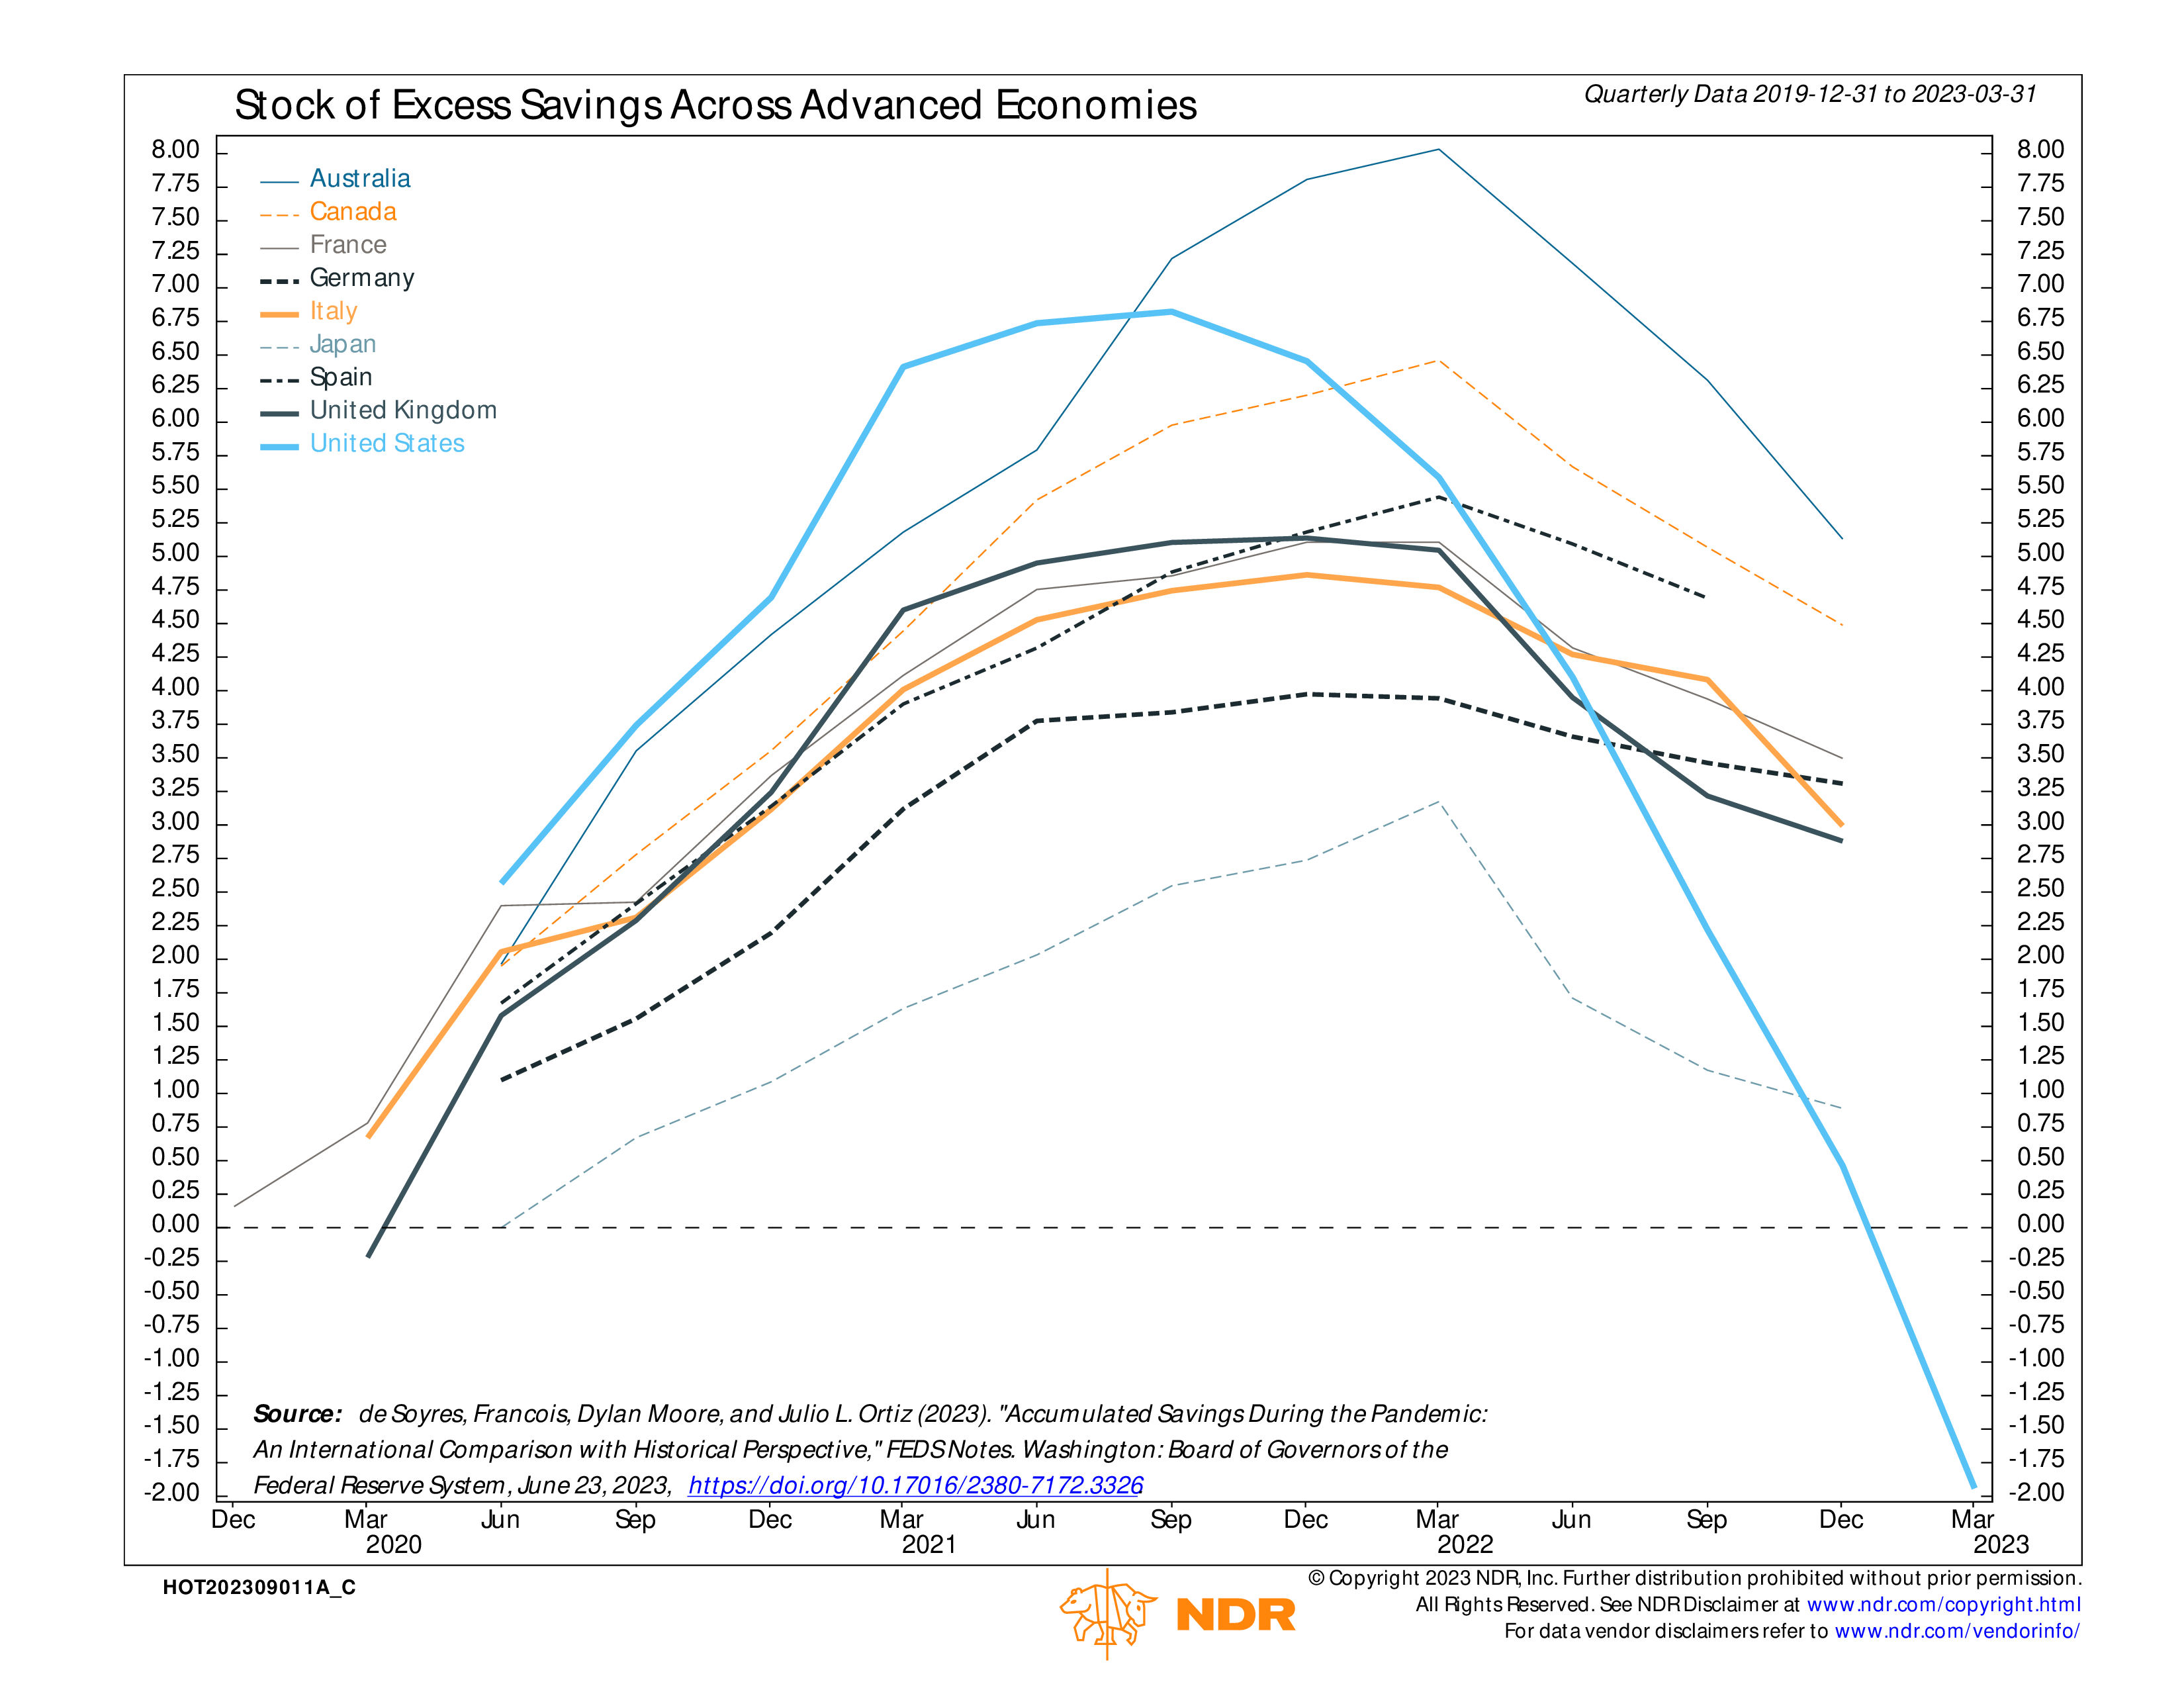
So far, the aggressive tightening campaign by the Federal Reserve hasn’t really affected the U.S. consumer. And by various measures, household consumption has continued to prop up a surprisingly robust economy. Many agree that the reason behind the consumer’s strength lies in the pandemic stimulus, which resulted in a boost to excess savings. However, as our featured chart this week reveals, those savings look like they have finally been depleted in the U.S.
The chart uses savings rates calculated by the Federal Reserve to measure the stock of excess savings in various advanced economies around the world. As you can see, they all roughly peaked around the first quarter of 2022. However, the United States (light blue line) actually exhausted all of its pandemic savings in the first quarter of this year, while the rest of the developed world remains in positive territory.
The takeaway? This chart likely explains why the U.S. economy’s performance has been so much stronger than the rest of the world. But it also implies that, now that the U.S. has used up all its excess savings, its performance might start to stutter a bit.
This is intended for informational purposes only and should not be used as the primary basis for an investment decision. Consult an advisor for your personal situation.
Indices mentioned are unmanaged, do not incur fees, and cannot be invested into directly.
Past performance does not guarantee future results.