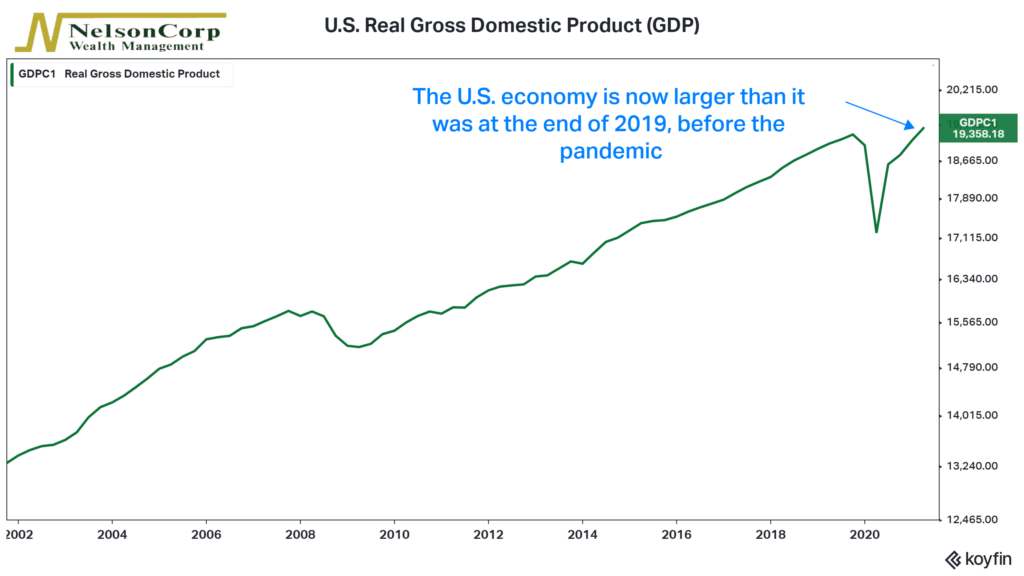
This week’s chart shows the United States’ Gross Domestic Product (GDP), adjusted for inflation. When people talk about the “economy,” it is generally the GDP they’re referring to. GDP measures the total market value of goods produced and services provided in a country, measured quarterly (every three months), making it a vital indicator of the economy’s overall health.
This chart of U.S. Real GDP is worth talking about today because the U.S. economy has officially recovered all its 2020 losses due to the pandemic. In fact, U.S. GDP is actually 0.8% larger than it was at the end of 2019 before the pandemic hit.
Strong growth in the first half of this year helped push the economy to this new high. GDP grew at an annualized pace of 6.3% in the first quarter and 6.6% in the second quarter.
Consumer spending was the main growth driver during this period, which makes the recent disappointments in both personal consumer expenditures and retail sales a bit concerning if they persist. However, economists still expect robust GDP growth for the rest of the year, which, if it materializes, could help bolster corporate earnings and stock prices.
This is intended for informational purposes only and should not be used as the primary basis for an investment decision. Consult an advisor for your personal situation.
Indices mentioned are unmanaged, do not incur fees, and cannot be invested into directly.
Past performance does not guarantee future results.