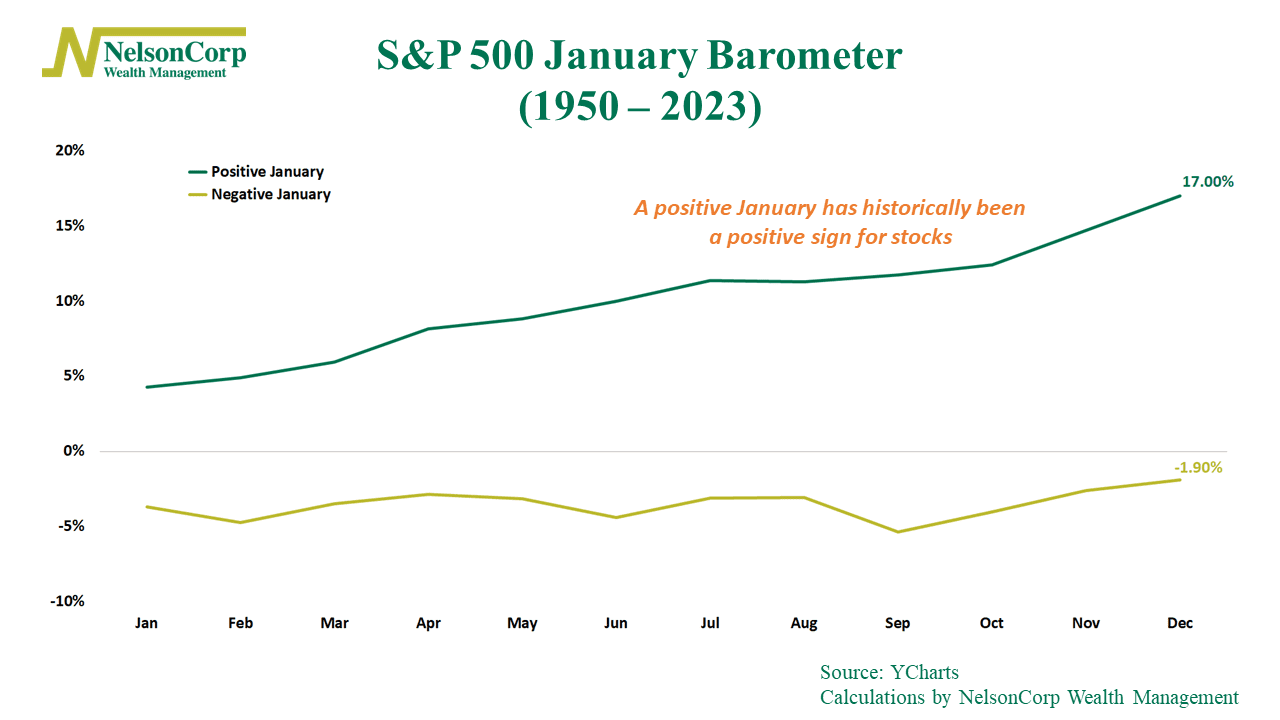
In 1972, Yale Hirsch, the author of the popular investment guide the “Stock Trader’s Almanac,” uncovered a fascinating stock market pattern he dubbed the “January Barometer.” Simply put, he observed that how the S&P 500 Index performs in January tends to foreshadow its performance for the rest of the year.
As the chart above shows, this concept has stood the test of time. Since 1950, years with a positive January have typically seen the S&P 500 deliver an average annual return of 17%. Conversely, when January starts on a negative note, the average yearly return for the market drops to -1.9%.
This disparity in returns between positive and negative Januarys is quite significant. I also looked at the stock market’s performance in other months, but none showed such a notable gap. For whatever reason, January really does set the stage for the market’s performance throughout the year.
Now, it’s important to note that there are exceptions to this pattern. The January Barometer doesn’t work every single year. But over the past 73 years, it has been more right than wrong—so it’s something to keep in mind. Right now, when we look at the stock market, the technical backdrop remains bullish, and this is further supported by a positive signal from the January Barometer—suggesting that the path of least resistance for stocks remains higher.
This is intended for informational purposes only and should not be used as the primary basis for an investment decision. Consult an advisor for your personal situation.
Indices mentioned are unmanaged, do not incur fees, and cannot be invested into directly.
Past performance does not guarantee future results.
The S&P 500 Index, or Standard & Poor’s 500 Index, is a market-capitalization-weighted index of 500 leading publicly traded companies in the U.S