If there’s one thing investors don’t like, it’s uncertainty. Unfortunately, now is one of those times when uncertainty is especially high regarding what is going on in Washington with the upcoming debt ceiling.
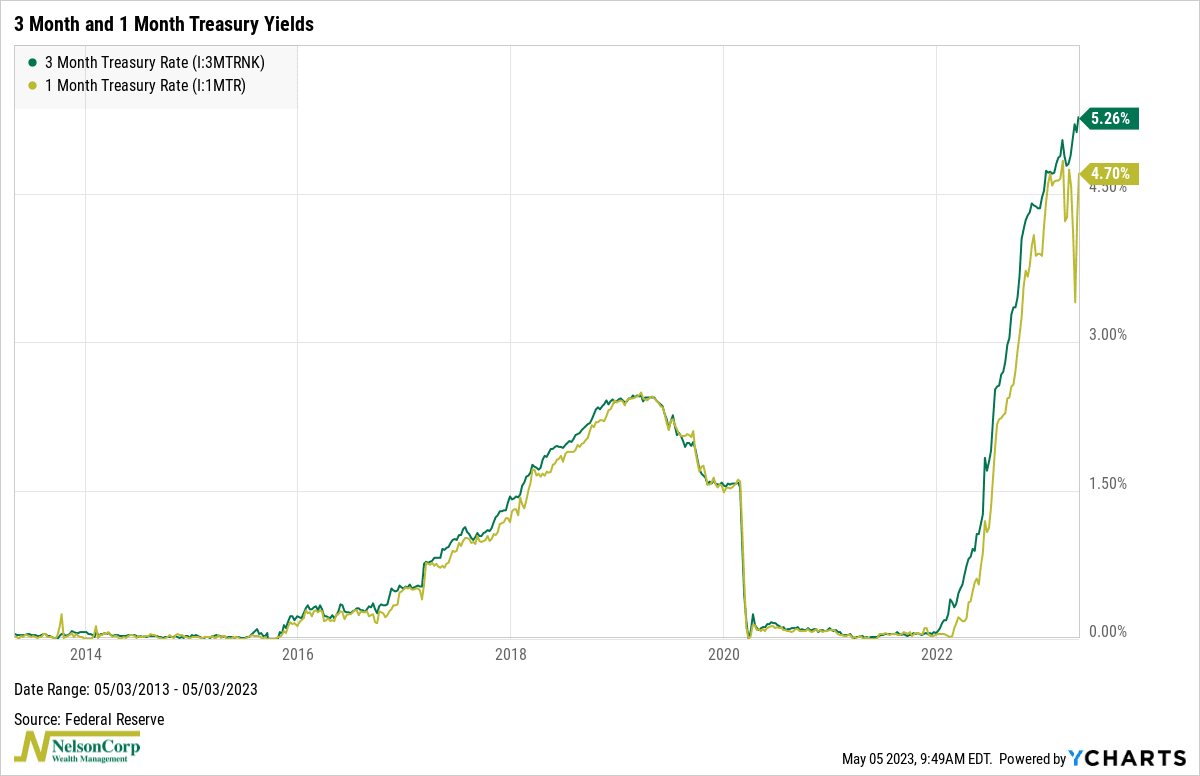
This week’s featured chart does a great job of illustrating just how nervous investors are. On the top clip, we have the yield on the 3-month Treasury bill (green line) versus the yield on the 1-month Treasury bill (gold line). Historically, these yields have tended to move in lockstep with each other. But recently, the largest gap on record opened between them.
Why? The likely reason has to do with investor angst over a potential default on U.S. debt. The U.S. Treasury has warned that it is expected to run out of money as soon as June unless the debt ceiling limit is raised. Due to these concerns, investors poured money into 1-month Treasuries, pushing those yields lower relative to slightly longer-dated 3-month Treasuries. This was a classic flight-to-quality trade as, for a moment, a 1-month Treasury bill was—oddly—significantly less risky than a 3-month Treasury bill. But alas, now that June 1st is less than a month away, those 1-month Treasury yields are again climbing as investors sell off their holdings.
All this volatility on the very short end of the yield curve is a great example of what we call “event risk.” The event, in this instance, is a potential default on U.S. government debt, and it could significantly impact financial markets and the economy.
The main takeaway, therefore, is that this is a good reminder of why we expect volatility to remain high in financial markets and why it’s as important as ever to know what you own in your investment portfolio and why.
This is intended for informational purposes only and should not be used as the primary basis for an investment decision. Consult an advisor for your personal situation.
Indices mentioned are unmanaged, do not incur fees, and cannot be invested into directly.
Past performance does not guarantee future results.