This week, I want to spotlight a research tool that does a great job of telling us where the stock market is likely headed next.
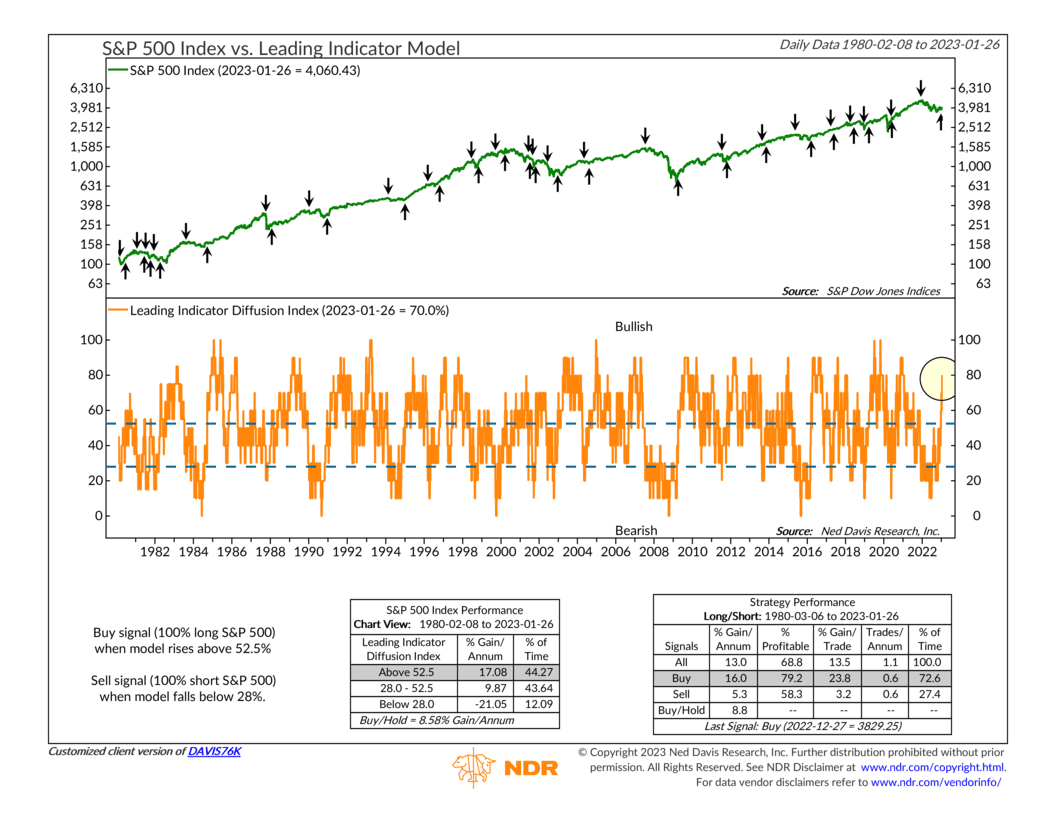
It’s called the Leading Indicator Model. As the name implies, the model consists of 10 indicators with a history of leading the S&P 500 Index higher and lower. The 10 components include things like the Financials sector, the percentage of stocks making new highs, advancing vs. declining stocks, and corporate bonds yields, among others. Each indicator is assigned a bullish or bearish reading depending on how it is performs in relation to key technical measures, such as the 50-day and/or 200-day moving average.
The Leading Indicator model is featured this week because it recently triggered a positive signal for the S&P 500 Index. The percentage of bullish indicators in the model rose to 70%—its highest reading since January 2021. Last year, none of the bear market rallies occurred with a Leading Indicator Model reading this high.
The implication? The current rally is in a more sustainable position than any of the failed attempts last year, making the current environment more conducive to at least a little bit of risk-taking.
This is intended for informational purposes only and should not be used as the primary basis for an investment decision. Consult an advisor for your personal situation.
Indices mentioned are unmanaged, do not incur fees, and cannot be invested into directly.
Past performance does not guarantee future results.